What is the Average True Range indicator in forex, and what does it do? This article will serve as a great introduction to this popular volatility indicator.
In 1978, a highly influential technical analysis book named ‘New Concepts in Technical Trading Systems’ was published. The late J. Welles Wilder Jr. authored this impressive body of work.

The American’s original profession was mechanical engineering before turning into real estate developing and trading the financial markets.
The man is essentially the father of numerous indicators discussed in the book that we now use. These include the ADX (Average Directional Index), RSI (Relative Strength Index), Parabolic SAR, and the ATR (Average True Range), the latter of which we’ll discuss in more detail.
It is fair to assume the ATR is one of the least utilized and often misunderstood indicators in forex, which is an understandable sentiment. Wilder Jr. had created the indicator for commodities, but it is very much applicable to the forex world.
Hence, this article will introduce the ATR, how it works, and the information it ultimately provides for traders to make better trading decisions.
What is the Average True Range?
The ATR is simply a technical indicator measuring market volatility by extrapolating several price ranges within a market to come out with an average. Like any tool, it’s always best to understand the very thing it attempts to calculate.
So, what is volatility? Volatility is a measurement of how much prices have fluctuated over a specific period. Let’s consider that we quantify price movements in currencies using pips. As expected, each pair in forex does not move the same number of pips at any given time because of how many people trade that market.
A highly liquid instrument like the euro will be more volatile than a pair like EUR/CHF since more people trade the former than the latter. Hence, the euro can move, say, 30 pips in a quicker span than its counterpart.
Essentially, volatility relates to how much ground a pair covers over a defined time frame. While seeming inconsequential, knowing this quality is vital for a few reasons, as you’ll eventually learn in the next few sections.
Like most volatility-based indicators, the ATR does not provide entry signals or a directional bias. Rather, traders use this tool to assess the volatility of a particular pair within a specific time frame.
Let’s now dive into how the ATR is calculated to understand better how it works.
How the ATR is calculated
The basic formula of the Average True Range is the greatest of the following:
(High of the current period) – (low of the current period) +
(Current period high’s absolute value) – (close of previous period) +
(Current period low’s absolute value) – (close of previous period)
In short, the ATR is an average pip calculation of the entire range of a bunch of candles within a time frame by calculating the differences between the highs and lows. Moreover, these calculations are then represented using a Moving Average on most trading platforms, typically an adjustable 14-day period.
We express this measurement in pips. So, in simpler terms, the ATR tells you the average number of pips a pair has moved over a specific time frame within the last 14 days.

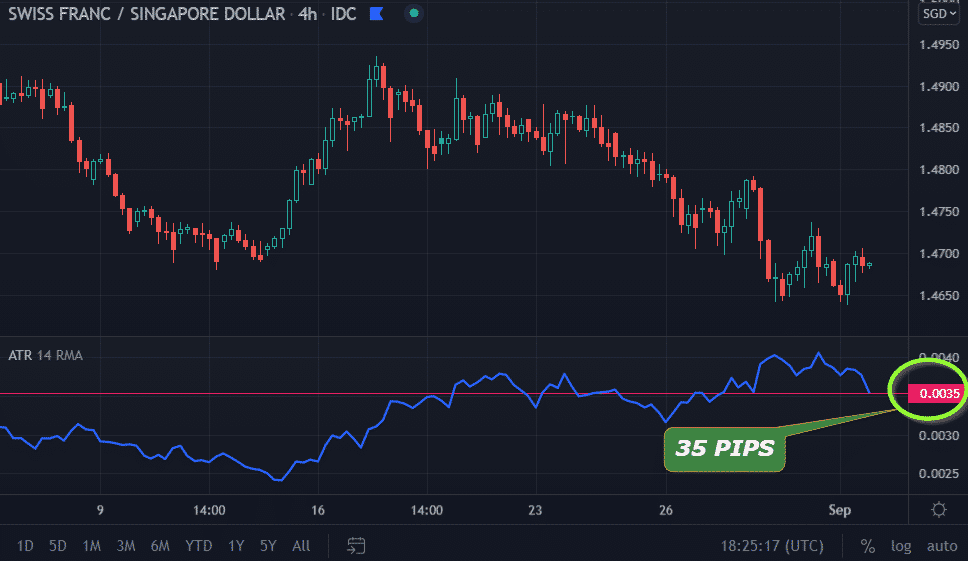
TradingView chart of CHF/SGD on the 4-hour time-frame
For instance, let’s consider the chart above. In this scenario, the ATR is 35, meaning how many pips this market has moved on average within this time frame. Of course, this will change after every four hours or whichever chart you’re utilizing based on how the price is moving.
It’s critical to understand the ATR measures the average pip range from the high to the low of each candle, giving you an idea of how much price could fluctuate within this period.
The main uses of the Average True Range
So, how do traders interpret the ATR? When price moves with strong momentum to the up or downside, we should expect volatility to increase since the price covers a greater distance in a short period.
Conversely, if momentum is low, volatility readings will follow suit and may suggest the current trend could be losing steam or taking a break.
The ultimate question to ask is why this information is helpful.
Setting your stops appropriately
The first application for traders using the ATR is to set their stop losses according to the current market conditions instead of making them too tight, too large, or setting them arbitrarily.
The rule of thumb is simply this: don’t use a tight stop when volatility is higher than usual, nor use a wider stop when volatility is lower than normal. You will be stopped out more often in the first instance, while your reward would be reduced drastically in the second scenario.
It’s about striking a balance. Most traders will use the ATR of the time frame they are trading from primarily as the basis for their stops. For instance, if you trade a setup on the daily chart, you would probably consider setting the stop according to that ATR to allow room for price to move between your entry and your stop loss.
Projecting profit targets
Another practical application of the ATR is for projecting profit targets after you’ve entered a position. There are a few things to consider here. Let’s assume you were trading off the 4-hour time frame on EUR/USD where the ATR was 30 pips.
After some time in the trade, you notice the ATR has reflected 50 pips. This could be the impetus to stay in the position a little longer as you expect the price to keep moving more in your favor because of the increased volatility.
You may decide to use a trailing stop or move your stop loss a bit closer to price than normally. Conversely, if the ATR keeps dipping after a while, this might make a trader reassess the position by choosing a smaller profit target or moving their stop a little closer.
Traders can apply this concept to any time frame once they have the patience to wait for new ATR readings.
Final word
Trading is about mastering the behind-the-scenes and what occurs afterward. Before you place a trade, you have to consider a few things: volatility is one of them. This is where the ATR is beneficial.
Secondly, although a “set and forget” approach is commendable, you still need to assess how the market behaves once you’ve entered a position. Ultimately, markets are constantly in a flux of high and low volatility, a perpetual ebb and flow.
So, the ATR is an invaluable tool for money management regarding setting your stops appropriately and getting the maximum profits possible.


