A very popular forex trading indicator, Average True Indicator (ATR) was first mentioned by J. Welles Wilder in his book in 1978. This indicator measures the volatility of the market. Volatility is the measurement of the strength of price action and is usually overlooked for clues on the market direction. However, you should not assume that the direction of volatility and trends are the same, because volatility can be high, while the market trends can be lower, and vice versa. So, do not confuse the ATR indicator with a trending indicator.
How to calculate the ATR?
There is no need to get into complicated formulas, as the calculation of ATR can be understood with some simple candle examples. ATR refers to the Average True Range. It means, that the indicator measures how much price moves on average.
According to the formation of the candles, ATR can be calculated by using any of these three methods:
- Current high minus the current low: When the range of the current candle is higher than the previous candle, this method is used.
- Current high minus the previous close: This method is used when the current candle closes higher than the previous candle.
- Current low minus the previous close: This method is used by traders when the current candle closes lower than the previous candle.
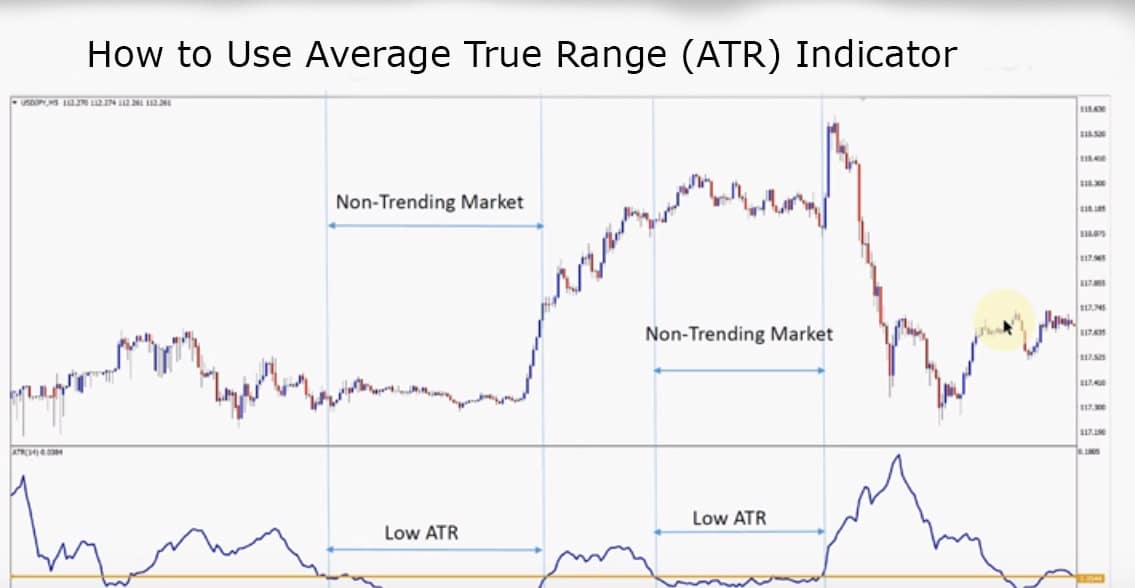
How to use the ATR indicator?
ATR is not only a tool that provides information on the current state or market, but traders can also use it for making trading decisions, stop loss, day trading and more.
ATR in trading decisions
A trader can use the information on the typical movement of an asset to determine a strategy for targeting profit and considering if trading should be attempted. Assume that a stock typically moves $1 in a day, but it is suddenly up to $1.20 on a day. With the trading range on 1.35, you can see the price moving 35% over the average. Now, you will get a buy signal from a strategy and it may be valid because the price has crossed the average. It may not be wise to bet that the price will go up continuously. However, you should be cautious because a price already over the average has more possibilities to fall. You may buy it when the price is close to the highest of the daily range, but when it goes beyond average, selling or shorting may be a better option. ATR is the tool that you can use in conjunction with a strategy for filtering trades like the situation mentioned above. You should approach a sell signal produced by a strategy with caution or ignore it and ATR can help in making this decision.
ATR to stop loss
Traders are always very cautious in trading, so they do not lose money, but it is annoying to be stopped out of the trades prematurely when you do not want to. You can fix this problem with ATR by trailing stop loss. It is a way of exiting a trade if the asset price goes against you but also allows you to move the exit point if the price is moving to your expected direction. With ATR, traders can figure out where they need to put the trailing stop loss. during a trade, see the current ATR reading. a common practice is multiplying it by two for determining a reasonable stop loss point. While shorting a stock, you can place the stop loss at 2xATR above the entry price and while buying the stock, the right place for a stop loss would be at the 2xATR below the entry price. In a long trade, the stop loss only moves up and waits until it can move up again or the trade closes, but it does not go down. To the opposite, In the short trades, the stop loss goes down only. So, by placing a stop loss with ATR, you can lock and ensure at least a certain amount of profit in any trade.
ATR in day trading
ATR can be used on intraday charts as well, like a chart of one minute or five minutes. This indicator spikes higher when the market opens and moves up during the first minute. It is because the moment the market opens, it is the most volatile time of the day and the volatility is higher than the previous day’s close is indicated by the ATR. After the spike during the opening, the ATR typically declines most of the day. It provides information about the movement of the price on average per minute. Apart from the asset’s movement throughout the day, day traders can also estimate the movement of price within five or ten minutes by using the one-minute ATR. It helps in establishing stop loss orders and profit targets by analysing about what can be expected to occur in the trade.
So, the ATR is a great tool when dealing with changing market conditions and is also a brilliant indicator to anticipate market turns. Traders that experience inconsistent results in trading due to their inflexible trading approach may find this universal trading tool useful.


