ForexEzy
No Result
View All Result
  • Home
  • Forex Education
    • Forex Basics
    • Forex Trading Strategies
    • Money Management
    • Risk Management
    • Technical Analysis
    • Fundamental Analysis
    • Trading Psychology
    • Social Trading
    • Automated Trading
  • Forex Tools
    • Forex Robots
    • Forex Indicators
    • Forex Signals
  • Top Forex Brokers
  • Top Forex Robots
  • Commentary
  • Blog
No Result
View All Result
ForexEzy
No Result
View All Result
Home Forex Education Forex Trading Strategies

Understanding Moving Average Envelopes and Moving Average Ribbon Trading Strategies in Forex

by Chintan Patel
February 18, 2020
in Forex Trading Strategies
0
understanding moving average envelopes and moving average ribbon trading strategies in forex
2
SHARES
11
VIEWS
Share on FacebookShare on Twitter

The forex market is a world of opportunities and traders can create simple trading strategies themselves to take advantage of the trading opportunities that may arise. There are many technical indicators available for Forex traders to do that, one of them being the Moving Average or MA.

Moving Average can be best described as one of the most frequently used technical indicators in the forex market, especially over the 10 to 200 periods. They are primarily used as trend indicators and to identify support and resistance levels. There are two types of MAs that are used: The Simple Moving Average and the Exponential Moving Average.

Understanding Moving Average Envelopes Trading Strategy

Moving Average Envelopes can be best described as percentage-based envelopes. They are generally set above and below the moving average. Forex traders have the option of using either a simple, weighted or exponential moving average since the type of moving average that is set does not matter.

When trading using Moving average envelopes, the best way to employ an envelope strategy is to test out different time intervals, different percentages as well as currency pairs. 

For instance, envelopes forming over a 10 to 100 day period can use bands that have a distance of 1 to 10% from the daily moving average. In case a trader is day trading, the envelopes can fall below 1%. Let us take the example of the chart below.

The above is a one-minute chart where the MA is 20 and envelopes are set at 0.05%. The percentage settings and other parameters may need to be changed on a daily basis, depending on the market volatility. Traders should thus use settings that would align his/her strategy below to the price action of the particular day. It is generally advised for traders to trade only in the presence of a strong directional bias to the price and consequently trade in that direction only. When experiencing a strong downtrend, traders should short when the price approaches the middle band and starts to drop away from it. On the other hand, if the price is in an uptrend, traders should consider purchasing when the price approaches the middle band MA and start rallying off of it.

Once a trader takes a short, a stop loss should be placed one pip above the recently formed swing high. Traders can look to exit the market when the price reaches the upper band on a long trade or the lower band in case of a short trade.

Understanding Moving Average Ribbon Trading Strategy

Traders can use the Moving Average Ribbon to create their basic forex trading strategy if there is a slow transition of a trend change and can be utilized in both directions.

The moving average ribbon was created, based on the belief that more is better in the context of plotting moving averages on a chart. It is formed by a series of exponential moving averages (usually 8 to 15) on a chart, which varies from very long-term to very short-term averages. The “ribbon” of averages thus formed, provides an indication of both the strength of the trend, as well as the trend direction. A strong trend is said to have formed when the angle of the moving averages becomes steeper, and the ribbon is widened because of greater separation between them.

In the Moving average ribbon, buy or sell signals can be likened to similar crossover signals employed in many other moving average strategies. A trader is thus advised to select the number of crossovers which they think, constitute a good trading signal.

understanding moving average envelopes and moving average ribbon trading strategies in forex

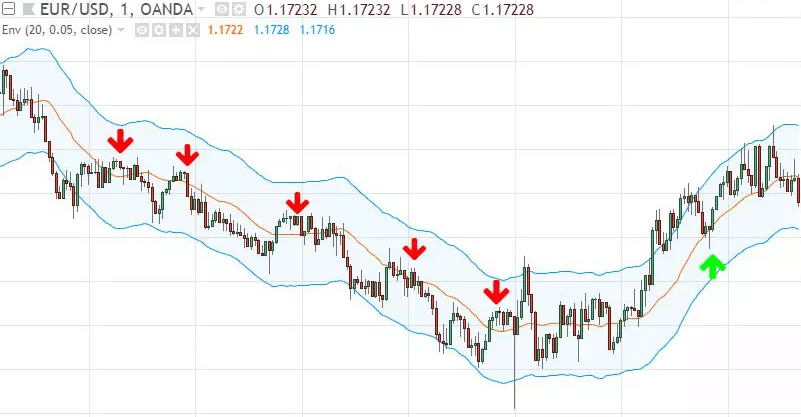
Chart showing technical analysis

Using the Moving Average Ribbon

Many traders use an alternate strategy to provide entries that are low risk but have high-profit potential. The strategy involves catching a decisive market breakout in any direction. This phenomenon usually occurs after the market trades in a tight and narrow range for a considerable period of time. Thus, to use this strategy, the following steps can be taken.

  • When the price flattens out into a sideways range and the moving averages converge closely together, traders should take note of this. The different moving average levels can come close together to form almost a single thick line as the separation between the individual moving averages become tiny.
  • The next step involves bracketing the narrow trading range, thus formed, with a sell order below the low of the range and a buy order above the high or the range.
  • In case a sell order is triggered, traders should place a stop level, just above the High of the range.
  • In case of a buy order, however, traders should place a stop-loss, below the low of the trading range.

There are several ways of using Moving Average as a part of a trader’s forex strategy, with Moving Average Envelopes and Moving Average Ribbon strategies, being just two of them. Traders should always thus, adjust their settings to check whether the strategies they have chosen provide favorable results.

Share2Tweet
Previous Post

How to Use Average True Range (ATR) Indicator in Your Forex Trading Strategy?

Next Post

Using MACD Indicator for Forex Trading

Related Posts

New York Close Charts in Forex – Why Are They Important for Daily Time-Frame Price Action?

New York Close Charts in Forex – Why Are They Important for Daily Time-Frame Price Action?

by Adam Stanley
March 19, 2021
0

Trading forex is a game of fine margins. Any trader seeks to find clarity in their technical analysis. Interestingly, the...

Multi-time frame Analysis in Forex Trading

Multi-time frame Analysis in Forex Trading

by Tim Baudin
February 23, 2021
0

Multiple time frame analysis (MFA) is a type of technical and price action analysis that involves looking at a currency...

ADX+RSI: The Unbeatable Forex Trading Strategy

ADX+RSI: The Unbeatable Forex Trading Strategy

by Chintan Patel
January 18, 2021
0

In order to pile up profits in the Forex market, you should choose a strategy that is backed by statistics....

An Introduction To Forex Trend Indicators

An Introduction To Forex Trend Indicators

by Adam Stanley
January 13, 2021
0

The trend is your friend’ is an old and popular expression in the financial markets. Consistently identifying the trend is...

Using Band Trading Strategy for Profits

Using Band Trading Strategy for Profits

by Adam Stanley
November 5, 2020
0

What is band trading? Do markets trend about 15 % of the time only?  So, what to do during the...

Load More

Leave a Reply Cancel reply

Your email address will not be published. Required fields are marked *

Best Forex EA

  • ROFX 9/10
  • Forex Fury 8/10
  • FXgoodway 7.5/10
  • Z Trader FX EA 7/10
  • Forex Incontrol Reborn 6.5/10

Popular News

  • The Best RSI and CCI Combination Trading Strategy for Optimum Returns

    The Best RSI and CCI Combination Trading Strategy for Optimum Returns

    2 shares
    Share 2 Tweet 0
  • Rofx Review – High Profitability and Stable Performance Analysis

    29 shares
    Share 29 Tweet 0
  • The Best Forex Scalping Strategy – Using 3 Popular Technical Indicators

    0 shares
    Share 0 Tweet 0
  • The Best MT4 Indicators & Expert Advisors For Forex Trading

    2 shares
    Share 2 Tweet 0
  • How to check if the indicator is repainting?

    2 shares
    Share 2 Tweet 0

Trading

Footer

We are dedicated to demystify the world of forex trading for you – no matter what level you are on.

Categories
  • Automated Trading
  • Day Trading
  • Forex Basics
  • Forex Brokers
  • Forex Education
  • Forex Forecasts
  • Forex Indicators
  • Forex Market Commentary
  • Forex Robots
  • Forex Signals
  • Forex Tools
  • Forex Trading Strategies
  • Fundamental Analysis
  • Money Management
  • News
  • Risk Management
  • Social Trading
  • Technical Analysis
  • Top World Traders
  • Trading Psychology
  • Uncategorized
Tags
arbitrage atr bollinger bands cci chart patterns classics copy trading courses day trading forex brokers forex charts forex ea forex education forex forecasting Forex Indicators forex software reviews grid trading hedging ichimoku macd market cycles news trading oscillators price action trading rsi social trading strategies tips & tricks trading bots trading platforms trend trading Video
  • Terms of Use
  • Privacy Policy
  • Compensation Disclosure
  • Risk Disclosure
  • About Us
  • Contact Us

Copyright © 2021 by ForexEzy.com

No Result
View All Result
  • Home
  • Forex Education
    • Forex Basics
    • Forex Trading Strategies
    • Money Management
    • Risk Management
    • Technical Analysis
    • Fundamental Analysis
    • Trading Psychology
    • Social Trading
    • Automated Trading
  • Forex Tools
    • Forex Robots
    • Forex Indicators
    • Forex Signals
  • Top Forex Brokers
  • Top Forex Robots
  • Commentary
  • Blog

© 2021, Forexezy.