The hook reversal pattern is a candlestick pattern which is also found in a bar chart. There are two ways of trading the forex hook reversal pattern as it can be either bullish or bearish.
A bullish hook reversal pattern is generally found after a downfall, indicating a possible bullish reversal.
What is the hook reversal pattern?
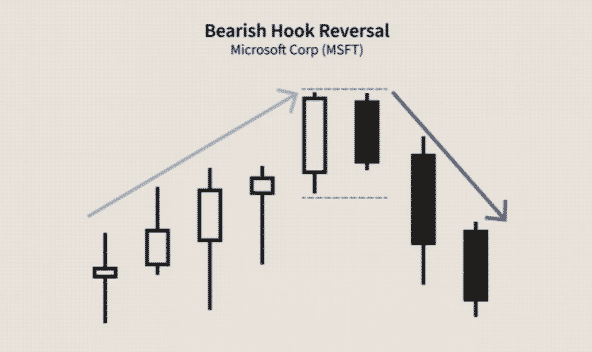
The bearish hook reversal pattern is generally found after an upward movement, indicating the possibility of bearish reversal.
Formation
When carrying out a hook pattern technical analysis, it is essential to remember it consists of two bars or candlesticks.
Just like in Forex, the pattern also works in the stock market. In a bullish stock hook reversal pattern, a bar or candle forms inside the previous bar’s range in a bullish stock hook reversal pattern after a downward movement. In the downward movement, bars form lower lows, but suddenly one bar creates both a higher low and lower high compared to the previous candle.
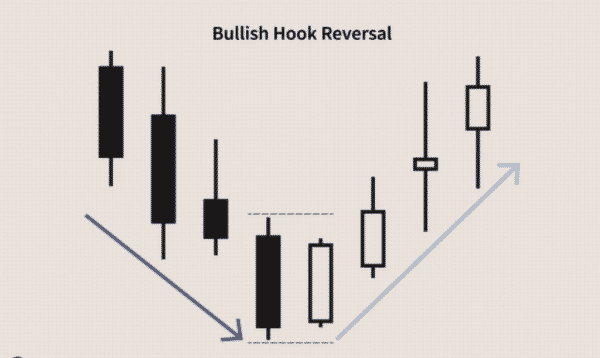
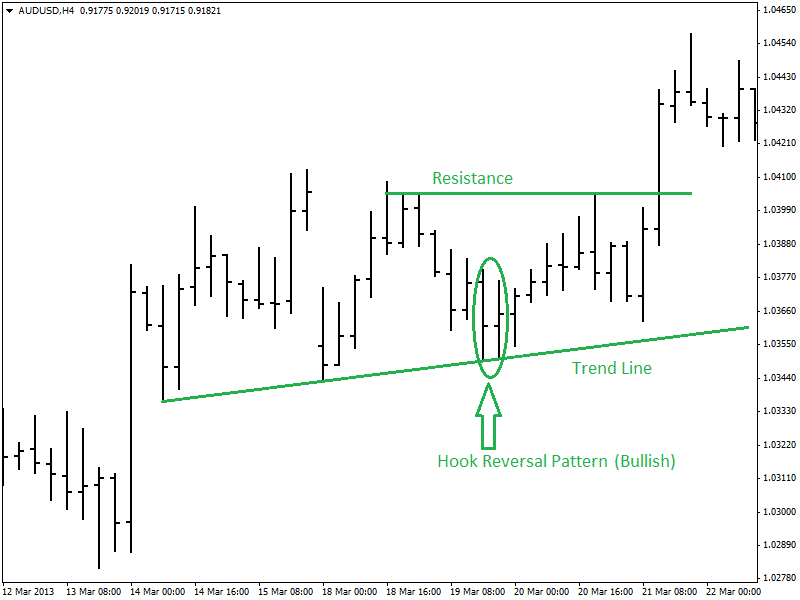
These two bars are known as bullish hook reversal patterns. Below is an example of a bullish hook reversal pattern.
The short-sell pattern comes up after a bar or candle forms inside the previous bar or candle range. This pattern is generally found after an upward movement when a bar suddenly creates a lower high and higher low compared to the previous bar.

Above is an example of a bearish hook reversal pattern.
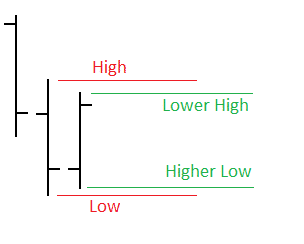
Hook reversal identification
Hook reversal is a short to medium-term candlestick reversal pattern commonly used to identify the start of a new trend. Depending on the time frame, it is characterized by higher-lows and lower-highs compared to the previous candlestick close.
While carrying out hook pattern technical analysis, one can spot bullish hook reversal and bearish hook reversal. Both are identified by two candlesticks that form when the price has significantly moved either up or down.
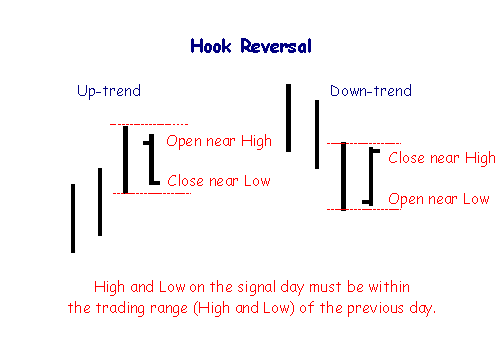
The bullish stocks hook reversal pattern is identified by a candlestick opening near the previous low and closing near the previous high. The way the candlestick closes signals waning selling pressure.
On the other hand, the Bearish stocks hook reversal pattern is characterized by a candlestick opening near the previous high in an uptrend but closing slightly above the last low candlestick. The way the candlestick opens and closes signals waning upward momentum.
Variations of hook reversal patterns
Bullish hook reversal
The setup appears when the price has moved lower significantly such that an asset appears oversold at the base. In hook pattern technical analysis, the outline occurs when bears appear to be in control, dominating price action, thus pushing prices lower.
The first large candle at the base of the pattern affirms short sellers in control and are likely to continue pushing prices lower. However, the situation reverses immediately with the second candle opening near the low of the previous candlestick, be it a daily or hourly chart.
The inability of the second candle to decline below the previous candle’s low signals that the market rejected the bottom area. In this case, sellers who enter sell positions face the risk of suffering losses. However, the candlestick fails to close above the previous candlestick, appearing to signal consolidation as bears and bulls face off at the base.
The third candle confirms a reversal of the downtrend has occurred on opening above the second candle and closing higher than the first and the second.
The second candlestick in the bullish forex hook reversal pattern often tries to signal that bearish momentum is waning, but buyers are not piling significant pressure to drive prices higher. However, the third candlestick often signals a correction has occurred, and that price is about to bottom out of a downtrend and move higher.
While the second candlestick opens below the previous close, it often closes higher to affirm a bullish hook reversal has occurred.
Bearish hook reversal
The reversal pattern occurs when the price is on an uptrend or has moved up significantly, affirming buyers in control. When it happens, it signals that the upward momentum is losing steam and that bears are likely to come into play and push prices lower.
The pattern starts with a candlestick opening near the previous high. However, the candlestick fails to close below the previous candle’s low to engulf it.
The second candlestick confirms bearish hook reversal is in play on opening slightly above the previous close but closes much lower. While the third candle opens slightly above the second, it closes below the first and the second, signaling building selling pressure.
This candle confirms sellers have overtaken control from buyers and that price is now set to start moving lower. For the pattern to work, there must be two solid bearish candlesticks from the top. A trade should also be taken after the second candlestick.
Hook reversal pattern setup
A forex hook reversal pattern consists of two candles, with the second one creating a narrower trading band than the previous. The pattern setup can appear when the price is trending up or down.
How reliable the pattern is, depends on the strength of the underlying trend and the length of time it took to form. Consequently, traders often use other technical indicators charts and candlestick patterns to confirm the reversal.
Characteristics
- The pattern occurs at the top or bottom of a trend.
- The bottom of the lower candle is always higher than the bottom of the previous candle.
- The shadow of the second candle should be very short.
Additionally, the pattern would be reliable if found at support and resistance areas as it is at these levels that reversal tends to occur. IAnd the volume in the second large candle should be high for the reversal pattern to materialize.
The reversal pattern is at times categorized as Harami or engulfing, given that the first candlestick that signals a reversal is about to happen and forms within the body of the previous candlestick. If the price was in a downtrend, the first hook reversal candlestick would be bullish but form inside the previous bearish candlestick.
Likewise, if the price was trending upwards, the first hook reversal candlestick would be bearish but form inside of the previous bullish candlestick as if to signal market consolidation. The candle forms within the body of the last, often creating dark cloud cover patterns.
While trading the hook reversal pattern, it is important to remember that the opportunity to enter a short or long position is more attractive if the pattern touches support or resistance level.
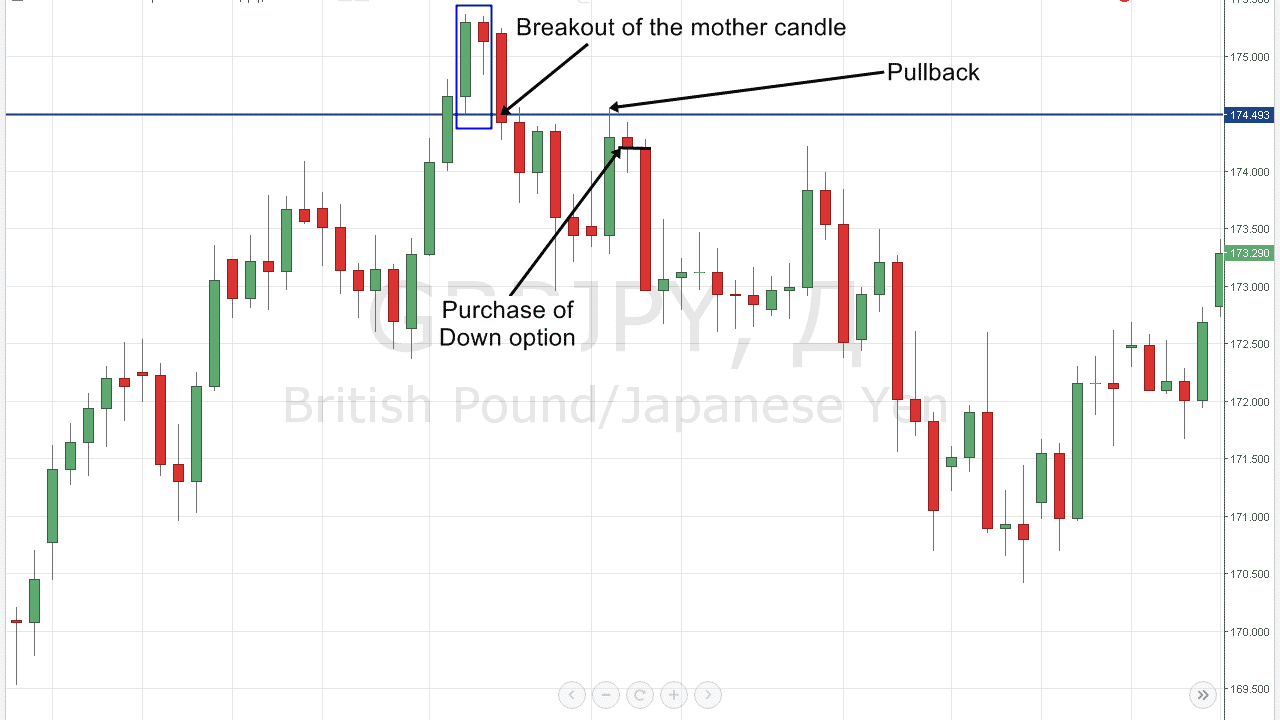
The chart above clearly shows that the opportunity occurred at a strong resistance level that tended up, triggering a huge sell-off to the downside. While the strategy is quite reliable, it is wise only to enter trades when the model is completely safe and a large bullish or bearish candle has occurred.
Additionally, there should be a slight pullback to the resistance or support level, which is immediately rejected, signaling a change in the direction of the trend.
Setting stop loss
While trading either the bullish or bearish hook reversal, it is important to be extremely cautious when placing stop-loss orders. In case of a sell order after the market has reversed from an uptrend, the stop loss can be placed a few pips from the top of the previous top candle.
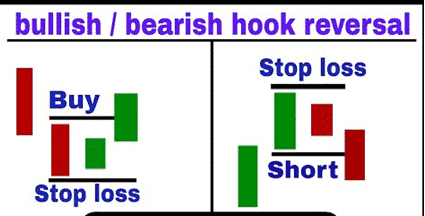
If the buy order on price reverses from a downtrend, the stop-loss order can be placed a few pips below the previous candle’s low.
On the other hand, a take profit order can be twice or thrice the stop loss value, or it can be placed near the next support in case of a bearish hook reversal or next resistance in case of a bullish hook reversal.
Examples of a hook reversal setup
Consider a GBPUSD chart below whereby price moved up until it hit a strong resistance level near the 1.6300 level.
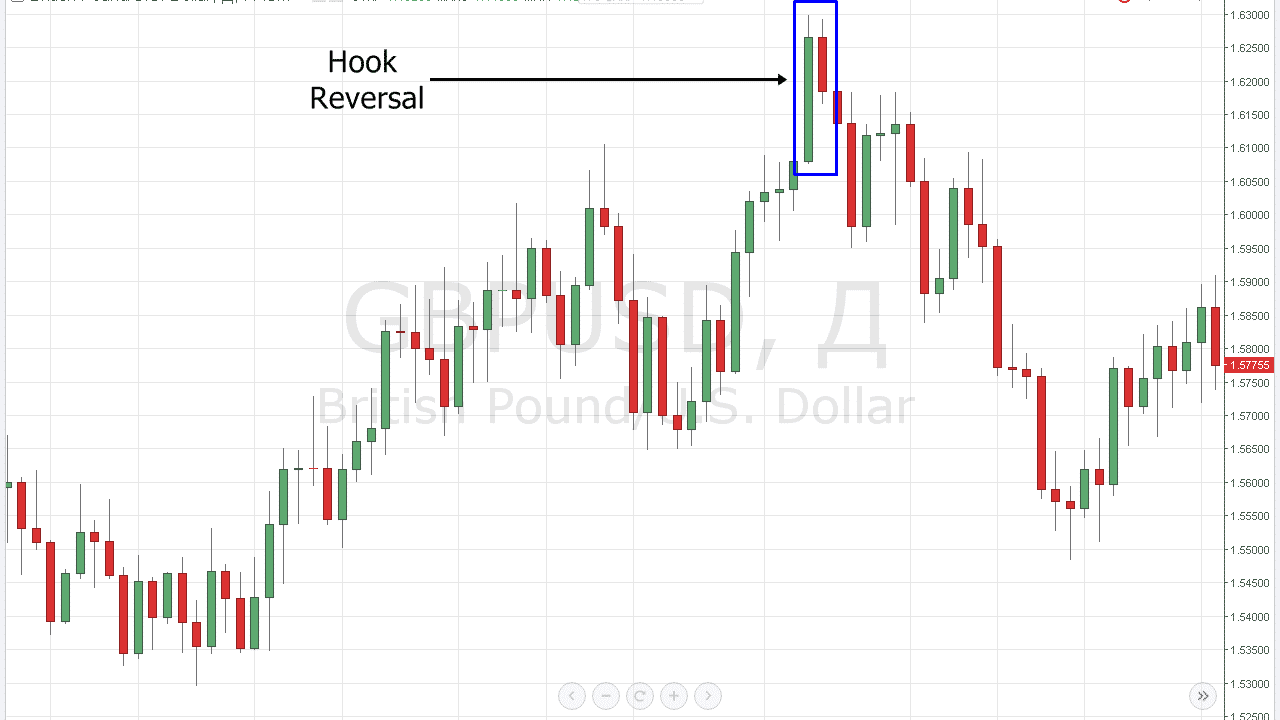
The uppermost bullish candlestick only confirms that bulls are in control and likely to continue pushing prices higher. However, that does not happen as the price gets rejected at the top. Consequently, the first red candle opens slightly below the last green bullish candlestick but fails to close below the previous low.
The Hook bearish reversal is only confirmed on the third candlestick opening inside the last bullish candle and closes below the last bullish candle to confirm bears in control. From this point, the price edges lower, signaling the start of a downtrend.
Hook reversal pattern trading rules
Hook reversal patterns can be traded in different ways. There are many indicators and strategies that are suitable for this pattern. The most popular trading approach is to trade this pattern with a trend line or support and resistance. For long positions, traders generally look for bullish hook reversal patterns near or at support lines.
Hook Reversal Pattern Trading Rules |
Should be traded with trend line and at support and resistance levels. |
Bullish hook reversal pattern at support signals buy opportunity. |
Bullish hook reversal pattern at resistance signals sell opportunity. |
This bullish hook reversal pattern near or at the support line indicates that the currency pair is bouncing back from the support line. A stop loss should be placed a little lower than the support line. The profit target should be determined by finding a resistance line.
Here is an example chart of the bullish hook reversal pattern with a trend line that is acting as a support line and resistance.
Traders take a short position as they find a bearish hook reversal pattern near or at the resistance. This resistance can be the horizontal flat line or a down-trending trendline. Stop loss orders are generally placed above the resistance line. Take profit or profit target orders are usually placed at the support level.
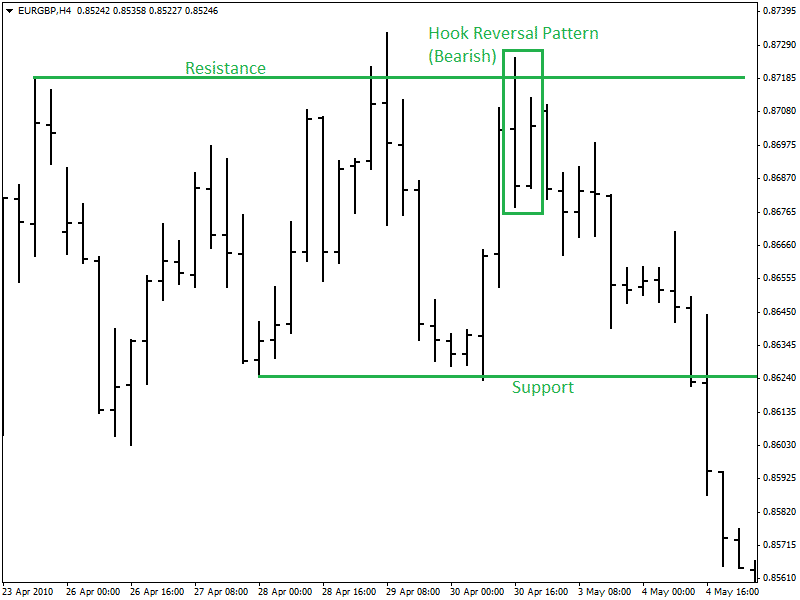
Above is a chart showing a bearish hook reversal pattern with support and resistance.
Hook reversal success rate
Hook reversal success rate is one of the highest when compared to other patterns used to predict reversals. Both bearish and bullish hook reversal patterns have a success rate of about 69%, one of the highest on the risk-reward front.
A break-even failure rate of 42% is significant. The failure rates can be much higher in the bull market, indicating the pattern has more chances of success in predicting downtrends.
Is hook reversal pattern suitable for beginners?
While the pattern is quite reliable to profit from, it is not simple and easy to distinguish. Therefore it can pose significant challenges to beginners just getting started in the business of trading.
The fact that the forex hook reversal pattern shares some attributes with other reversal patterns makes it difficult to trade, especially for beginners. The prospect of a wrong signal or price continuation immediately after a reversal is usually high.
Given that the setup looks like a candlestick followed by a small body, which overlaps and is contained within a range, it can at times be difficult to spot, especially for people who are not used to price action.
Additionally, the hook reversal pattern can be confused with a dark cloud cover pattern or engulfing pattern and, at times, a Harami pattern. Therefore, it is important to master these other patterns for a beginner to identify the forex hook reversal pattern accurately.
Beginners can make good use of it and profit from reversal. A lot of money in the financial markets is generated from reversal patterns as they allow one to open a position when a trend is forming; therefore, ride the new wave either to the downside or upside until a correction occurs.
Summary
The hook reversal pattern is an advanced candlestick or bar pattern. It is an effective pattern for trading if used properly with other indicators. A bar having a higher low after bullish forex or stocks hook reversal pattern is the confirmed entry point for a long position.
Inversely, a bar or candle having a lower high after a bearish hook reversal pattern is the more confirmed entry point for a short position. The pattern appears in both uptrends and downtrends, allowing traders to open trades early when a new trend is starting.
However, the pattern is not easy to determine or spot, especially for novice traders, as it resembles other reversal patterns. Traders who understand and know how to combine other technical analysis tools can leverage either forex or stock hook reversal pattern to generate significant returns when a new trend is getting started.


