Cryptocurrencies are some of the most volatile assets in the capital markets. Wild price swings are a common phenomenon in the burgeoning sector driven by fear, greed, and hype. Consequently, analyzing price action in the sector can be challenging, given how unstable most coins are.
While traders rely on technical indicators to gain insight into how price is moving, there are unique tools that some players use to gain an edge while trying to forecast cryptocurrency price action.
Below are the top 5 best crypto indicators every trader should know.
The Crypto Fear and Greed Scale
The crypto fear and greed scale is a unique crypto indicator that tries to measure emotions known to influence traders’ and investors’ activities in the sector. The lack of fundamentals that market participants can use to value cryptocurrencies accurately sees most of the participants act on their emotions, driving crypto prices up and down.

The indicator provides insight into the underlying volatility of cryptocurrency and market momentum, and social media chatter. It also measures emotions allowing market participants to understand the prevailing market sentiment, either bullish or bearish.
How it works?
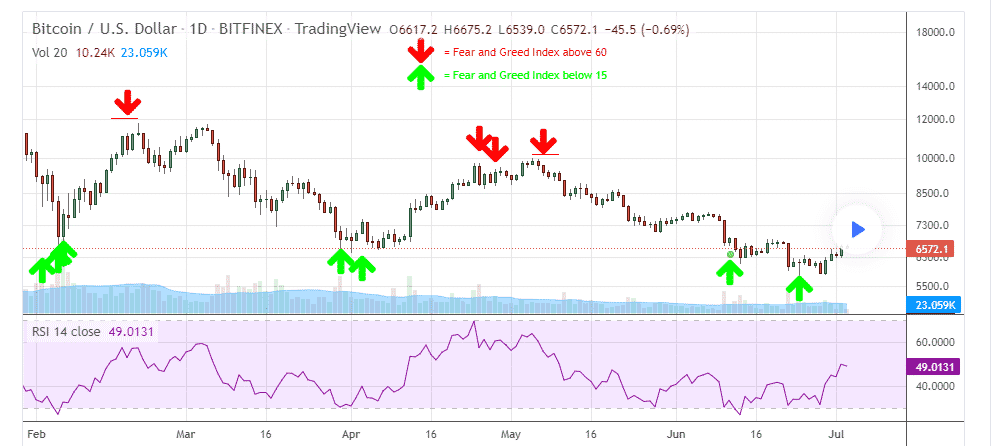
The crypto fear and greed scale indicator comes with readings of between 0 and 100. A lower score of below 50 implies there is fear in the market, which suppresses cryptocurrencies prices. Consequently, when the reading is below 50, it means a cryptocurrency is under short-selling pressure and likely to tank.

Extreme fear comes into play when the indicator’s readings slump below 24. When there is intense fear, market participants are selling the cryptocurrency in volume, which can lead to oversold conditions. An extreme sell-off can present a good buying opportunity as part of the buying the dip play. In the chart above, it is clear that BTCUSD bounced back as soon as the RSI was oversold.
In contrast, the greed characterized by buying pressure comes into play when the indicator reading rises above 50. In this case, the crypto price is expected to continue increasing, affirming buying opportunity.
Extreme greed comes into play when the indicators reading are above 75. While the indicator reading can remain above 75 for a prolonged time, the prospect of a reversal is usually high, given the overbought conditions in play.
Bitcoin dominance
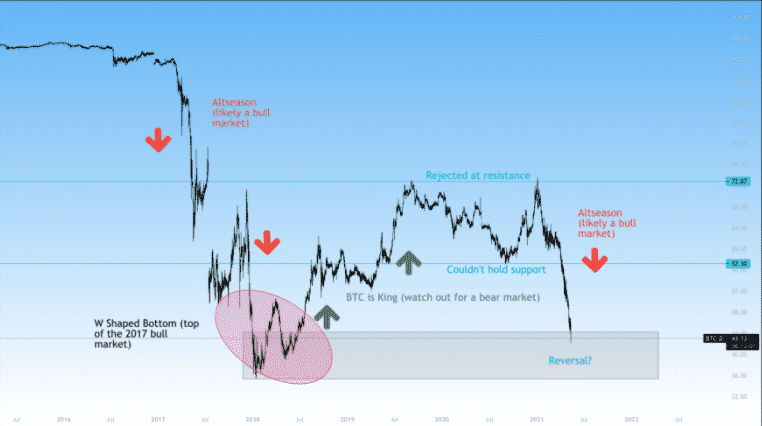
Bitcoin dominance is another unique tool that can determine whether crypto is poised to trend higher or lower—the metric measures Bitcoin market capitalization in relation to other cryptocurrencies.
When BTC dominance rises, it means market participants are pouring investments into the flagship cryptocurrencies and shunning altcoins. In this case, altcoins tend to be under pressure as more investments end up in Bitcoin. BTC dominance affirms higher trading volume in BTC, which supports higher BTC prices and a sell-off of altcoins.

When Bitcoin dominance declines, it means market participants are shrugging Bitcoin in favor of altcoins. Consequently, market participants use this opportunity to eye long or buy positions on various altcoins. Lower BTC dominance affirms lower BTC trading volume and higher altcoins volume.
However, Bitcoin dominance is never a true representation of bear and bull cryptocurrency markets. For instance, during periods of bull markets, lower BTC dominance might be in play as funds pour into altcoins. Similarly, bear markets may be characterized by more funds flowing into BTC than altcoins.
Tracking volume 24h
Volume is one of the most important metrics to consider while analyzing cryptocurrencies. It replaces the lack of fundamentals making it easy to know whether more people are buying or shunning a cryptocurrency.
Whenever the trading volume increases, it implies a buildup in buying pressure. Consequently, market participants use this opportunity to eye long positions as increasing volume signals a strong uptrend. Similarly, when the volume is low, it implies a lack of strong buying pressure to support higher prices.
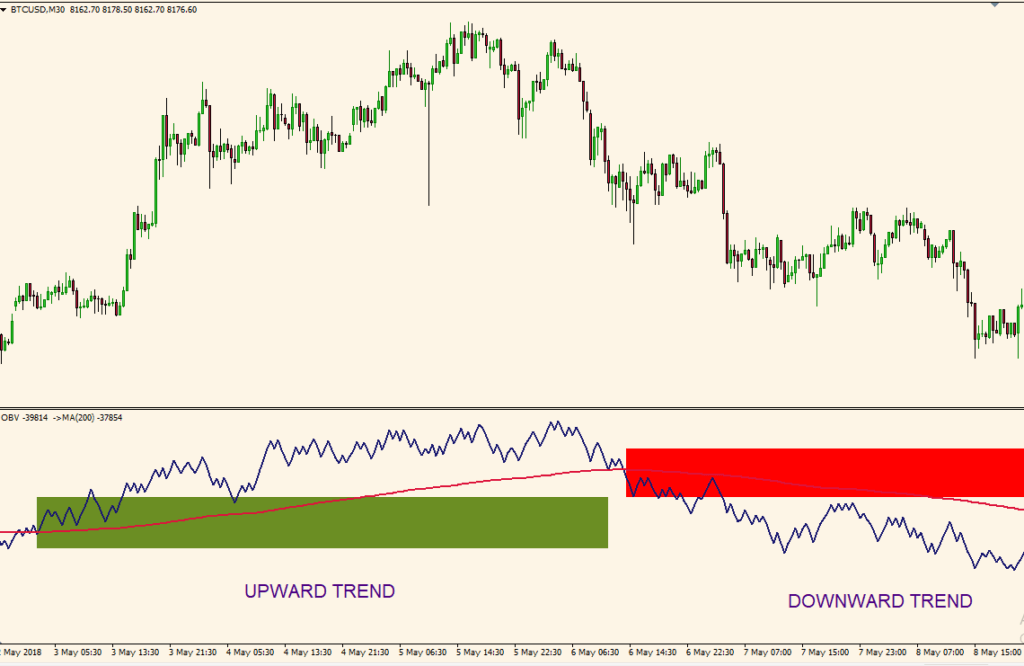
On-Balance-Volume (OBV) is the most popular indicator for analyzing the total volume in any cryptocurrency. The indicator confirms the underlying trend by moving along with the price. It’s also used to spot potential reversal points.

Whenever the OBV is trending up, buying pressure is building up, and more market participants are buying the altcoin. Consequently, market participants use this information to eye long positions. When the OBV is trending lower, it implies a decline in volume, something likely to fuel a decline in prices.
The indicator also signals potential reversal whenever the price and the indicator move in the opposite direction. For instance, whenever the indicator is moving up, but the price continues making lower lows, the prospect of a price reversal is usually high. After some time, the price might reverse and start moving up to align with the indicator?
Twitter sentiment
Real-time data posted on social networks can have a significant impact on how crypto prices fluctuate. The hype that happens on social networks goes a long way and triggers emotions among traders, all but driving cryptocurrency prices up and down.
Meme coins are a perfect example of altcoins that trade based on the hype on Twitter and other social networks. Whenever high-profile personalities and celebrities post positive news or developments about altcoins, the prospect of prices edging higher is usually high.
Similarly, any negative campaign or news on social networks tends to have a negative impact on sentiments, all but triggering sell-offs.
Tracking the IC15
India is home to one of the biggest stock markets in the world. The creation of a new crypto index dubbed IC15 index provides a new way of tracking 15 of the most traded cryptocurrencies listed on some of the biggest exchanges globally.
The index serves as a benchmark providing insights on the developments and sentiments in the broader sector. Consequently, the index can also be relied upon to gauge the market sentiments, which can be used to make investment decisions on various altcoins.
For instance, whenever the IC15 is rising and increasing in value, the same could imply a buildup in buying pressure in the overall sector. Market participants can use this opportunity to purchase individual coins. Similarly, when the index is plunging, the same could imply a risk-off mood, a sign that crypto prices are likely to tank.


