ForexEzy
No Result
View All Result
  • Top Forex Advisors
    • Best Forex Robots
    • Best Forex Signals
    • Best Managed Accounts
  • Top Forex Brokers
    • Best Forex Brokers
    • US Forex Brokers
    • UK Forex Brokers
    • MT4 Forex Brokers
    • MT5 Forex Brokers
    • Zero Spread Brokers
    • Best PayPal Brokers
    • TradingView Brokers
    • Social Trading Platforms
  • Top Review Platforms
  • Forex Education
    • Getting Started
    • Forex Basics
    • Forex Trading Strategies
    • Money Management
    • Risk Management
    • Technical Analysis
    • Fundamental Analysis
    • Trading Psychology
    • Social Trading
    • Automated Trading
  • Forex Tools
    • Forex Robots
    • Forex Indicators
    • Forex Signals
    • Forex VPS
  • Forex Forecast
  • Crypto
    • Best Crypto Exchanges
    • Best Crypto Bots
    • Crypto Guides & Forecasts
No Result
View All Result
ForexEzy
No Result
View All Result
The World’s Leading Social Trading Platform
Try now
Home Cryptocurrency Trading

50-200-EMA Crypto Trading Strategies for Beginners

by Adam Stanley
June 8, 2022
in Cryptocurrency Trading
0
50-200-EMA Crypto Trading Strategies for Beginners
0
SHARES
11
VIEWS
Share on FacebookShare on Twitter

Moving averages find great use in price chart analysis. They are commonly used as they provide insight into current price movements and the direction it is likely to move. Additionally, their ability to provide valuable insights on all time frames elicits strong interest from short-term and long-term traders.

The Best Forex Robots Report Is Already Here!
best forex robots
Check out 30+ best expert advisors with daily updated live results and statistics
Click Here

Understanding the 50 exponential moving average

The 50 EMA is a special moving average calculated using the past 50 periods. In a 5 minute chart, it takes into consideration the most recent 50 candlesticks to show the direction of the market. It is different from the 50SMA as it pays more attention to the most recent price movement.

It is considered a fast-moving, moving average as it responds rapidly to price changes. Conversely, it finds great use in day trading, whereby traders look to profit from short-term price changes. Long-term traders can also use it to generate entry and exit levels when paired with a slow-moving, moving average.

The 50 EMA: Buy and sell strategy

The 50EMA responds rapidly to price changes and, therefore, provides ideal entry levels in day trading. Whenever the price is above the indicator, it is considered to be in an uptrend. Conversely, a trader can look to enter buy positions.

Once the price breaks above the 50EMA, the trend has changed from a downtrend to an uptrend. Instead of blindly entering a buy position because the crossover signals the start of an uptrend, it would be wise to wait for a pullback to the indicator.

Chart showing buy set up above 50EMA

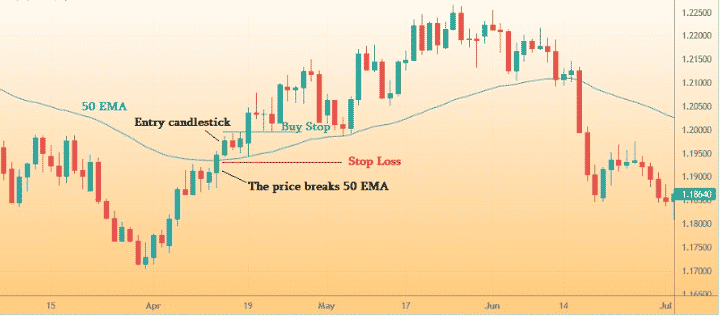
If the price holds above the 50EMA on a pullback after the initial rally, it means bulls are in control, and that price is likely to increase. Consequently, now would be the best time to enter long positions, as shown above. Buy positions can be opened as long as the 50EMA acts as support on any pullback.

As part of risk management, a stop-loss can be placed a few pips below the level at which the price crossed the 50EMA and moved up, signaling the start of an uptrend.

Similarly, the indicator can provide valuable insight into the appropriate time to enter short positions. Whenever the price is below the 50EMA, it implies the market is in a downtrend, and prices are likely to continue tanking.

Chart showing sell set up below 50EMA

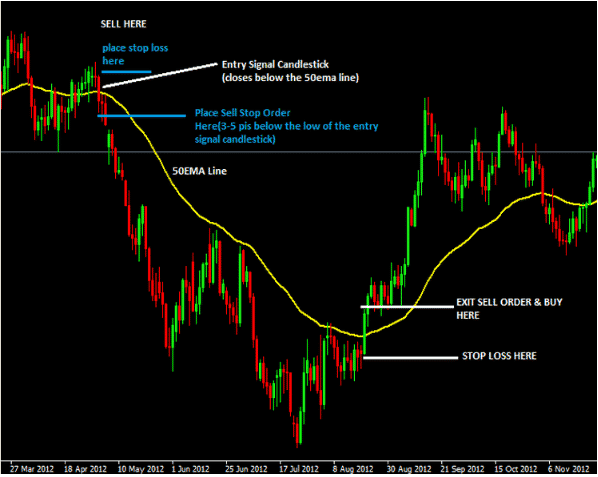
A trader should be prepared to enter short or sell positions once the price closes below the 50EMA. However, confirmation of an entry would be as soon as the price bounces back to the 50EMA after moving lower, only to be rejected and start moving lower. The stop loss can be placed a few pips above the level at which the price crossed the 50EMA and started moving lower.

Understanding the 200EMA

The 200 EMA is a long-term moving average that responds slowly to price changes. Conversely, it is commonly used by long-term traders who keep positions running for months. Short-term traders can also use it.

However, the 200EMA finds use in predicting how asset or security prices will be in a few months. Consequently, it is commonly used in higher time frames such as daily, weekly, and monthly charts to understand the underlying trend.

The 200EMA: Buy and sell strategy

While using the 200EMA, a buy opportunity comes into play on price crossing the indicator and moving up. The crossover that occurs signals the market has turned bullish and that prices are likely to move up. Once crossover happens, and the price tries to pull back only to experience strong buying pressure and move up, signals bulls are in control.

Chart showing sell set up below 200EMA

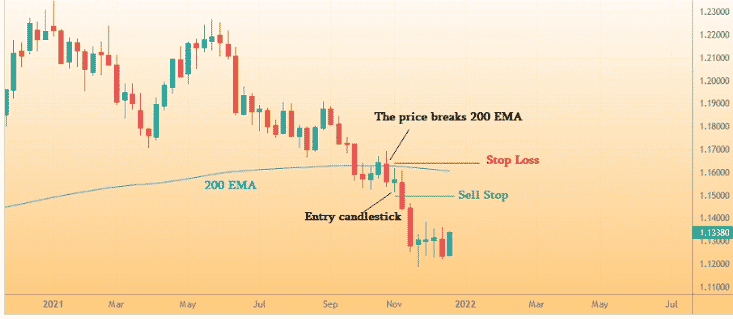
A sell opportunity using the 200 EMA arises on price crossing the 200EMA and moving lower. The crossover implies strong bearish momentum. A confirmation to enter a short position would come into play on price bouncing back to the EMA only to be rejected, followed by a strong move lower.

50-200 Moving average crossover strategy

While the 50EMA and 200EMA can be used in isolation, they can also be used to complement one another to provide much more accurate trading signals. A crossover happens whenever the fast-moving MA crosses the slower-moving MA.

Chart showing 50-200 crossover

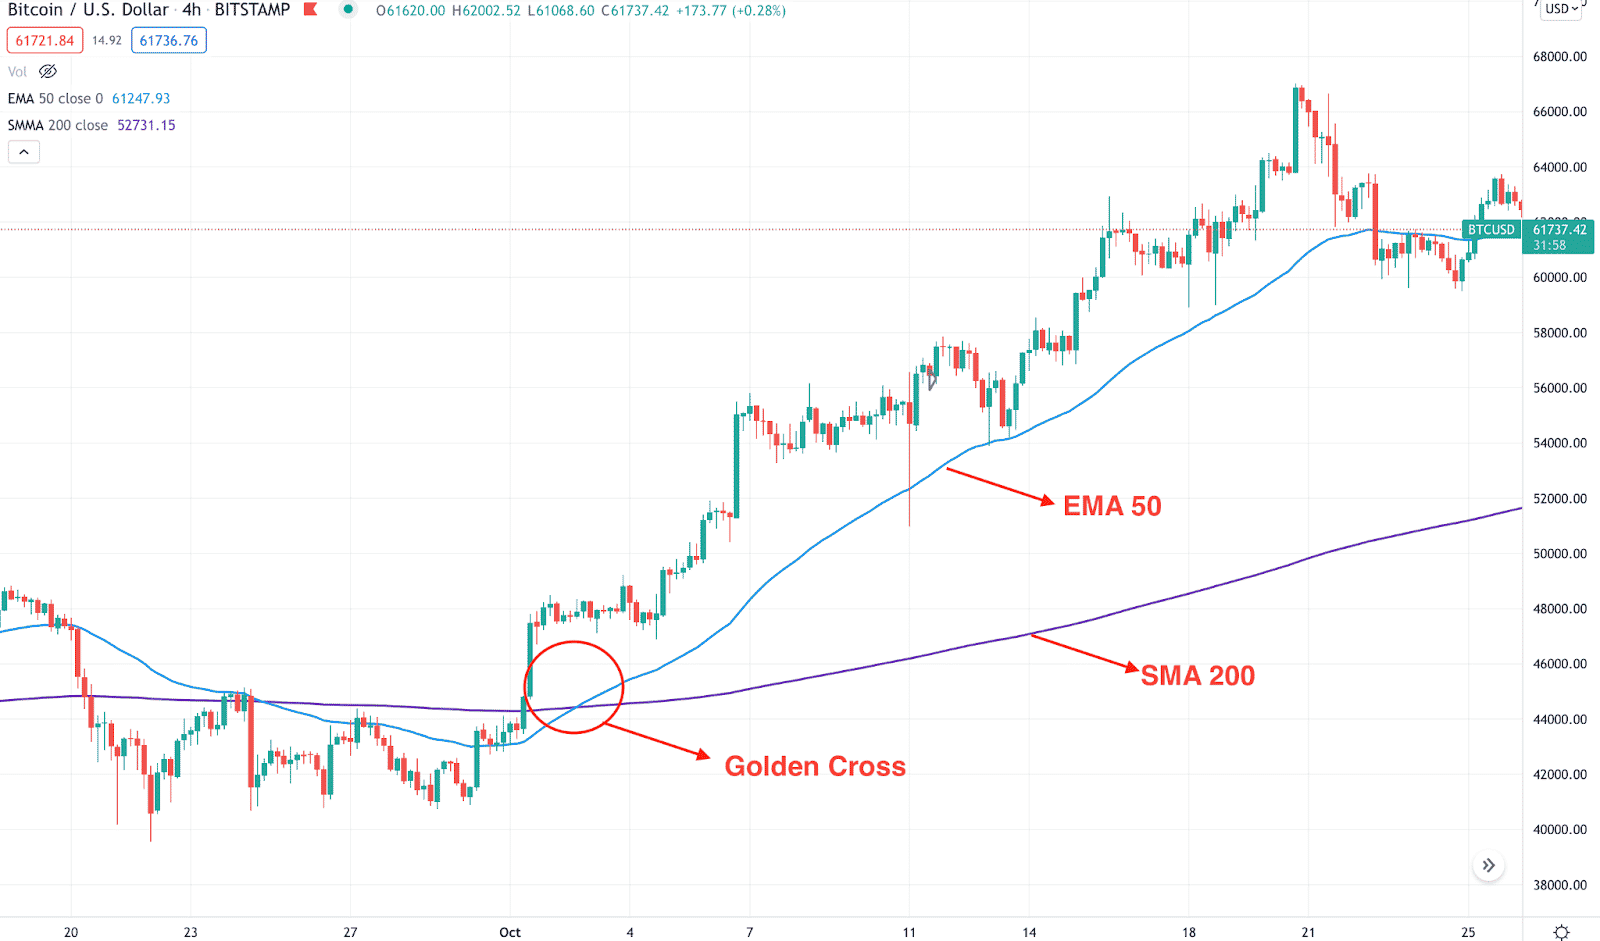
Whenever the fast-moving 50EMA crosses the slow-moving 200EMA and moves up, it implies a buildup in buying pressure. Technical traders use this opportunity to eye buy positions as the prospect of price rallying with this setup is usually high.

Once the price moves above the two EMA, it implies the start of an uptrend. Technical traders use this opportunity to eye long positions on any pull back to the 50EMA, followed by a strong bullish candlestick. The 50EMA turns out to be the support level from which the price bounces back and continues to move up, registering higher highs.

Likewise, whenever the 50EMA crosses the 200EMA and starts moving lower, it implies a buildup in selling pressure. The prospect of price tanking is usually high. Therefore traders use this opportunity to eye sort positions.

As soon as the price moves below the two EMAs, traders can open short positions. Any bounce back to the 50EMA after the crossover that is followed by a big bearish candlestick implies short sellers are in control and a higher likelihood of price tanking. The 50EMA will end up being a resistance level from a high price and will continue moving lower on any bounce back.

Divergence and convergence

When using the 50EMA and 200 EMA, divergence and convergence are common occurrences. Divergence occurs whenever a crossover occurs, resulting in prices moving in a new direction with force.

With divergence, the 50EMA will move further away from the 200EMA, signaling the new upward or downward momentum is strong. The further apart the two are from one another, the stronger the new trend.

Chart showing divergence and convergence

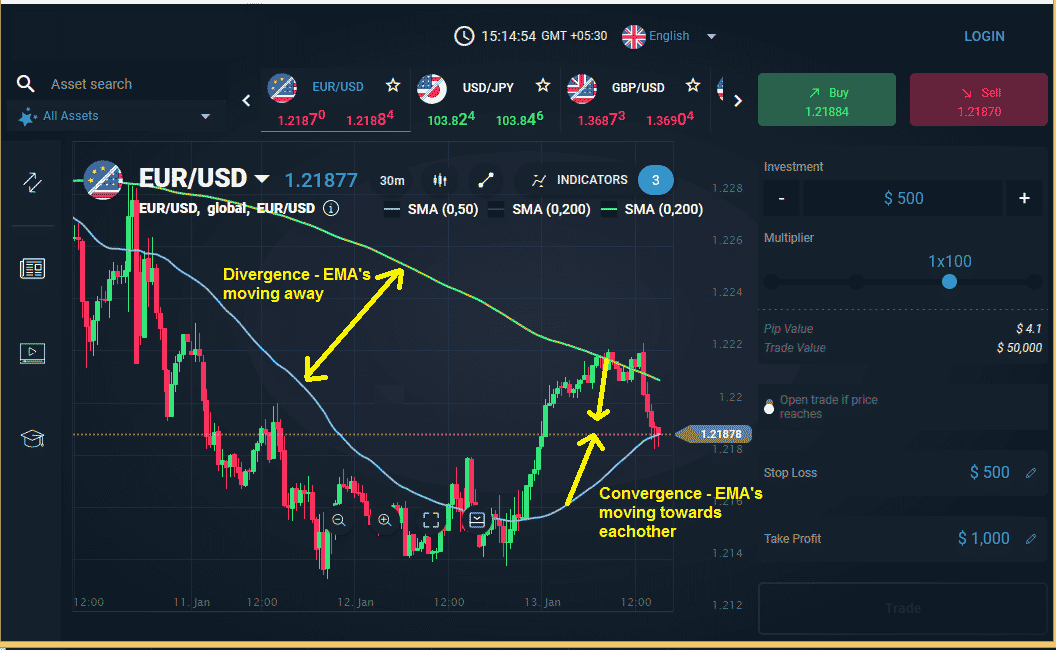
Convergence, on the other hand, occurs whenever the 50EMA starts moving closer to the 200EMA. It implies the prevailing momentum is waning. For instance, if the price was moving lower as convergence occurs price will start moving up, signaling change of trend from a downtrend to an uptrend

Bottom line

The 50EMA and 200EMA are excellent trading indicators for ascertaining the prevailing market trend. While they can be used independently to determine trend, they tend to provide accurate results given the crossovers that come into play when used concurrently.

The Best Forex Robots Report Is Already Here!
best forex robots
Check out 30+ best expert advisors with daily updated live results and statistics
Click Here
ShareTweet
Previous Post

Dfyn Decentralized Exchange Review

Next Post

Orca Decentralized Exchange Review

Related Posts

Shrimpy.io review

by Tim Baudin

It is advisable to use the Shrimpy.io platform to work with crypto assets. It allows you to put together all...

KuCoin review

by Tim Baudin

Trading on the stock exchanges is always full of surprises. Often they are unpleasant, so traders have to endure various...

Gemini review

by Tim Baudin

Operations with cryptocurrency are a modern direction of trading. For their safe and profitable conduct, you should use the services...

Solarbeam Decentralized Exchange Review

Solarbeam Decentralized Exchange Review

by Adam Stanley

Solarbeam background Solarbeam is a decentralized exchange that strives to give the cryptocurrency community a comprehensive and convenient one-stop platform....

TWAP Bot Review: Is It a Legit Crypto Bot?

TWAP Bot Review: Is It a Legit Crypto Bot?

by Chintan Patel

TWAP Bot applies one of the simplest trading strategies in the crypto market. The bot is one of the listed...

Load More

Leave a Reply Cancel reply

Your email address will not be published. Required fields are marked *

Best Forex Automated Systems

  • TechBerry 9/10
  • Happy Galaxy 8.5/10
  • Forex Cyborg 8.5/10
  • Forex Fury 8/10
  • FXgoodway 7.5/10
  • Best Forex Brokers
  • Best Forex Robots
  • Best Forex Signals
  • Best Forex Managed Accounts

Top Trading Markets

We are dedicated to demystify the world of forex trading for you – no matter what level you are on.

Categories
  • Automated Trading
  • Crypto Robot Review
  • Cryptocurrency Trading
  • Day Trading
  • Forex Basics
  • Forex Brokers
  • Forex Education
  • Forex Forecasts
  • Forex Indicators
  • Forex Market Commentary
  • Forex Robots
  • Forex Signals
  • Forex Signals
  • Forex Tools
  • Forex Trading Strategies
  • Forex VPS
  • Fundamental Analysis
  • Managed Accounts
  • Money Management
  • News
  • Review
  • Review Platforms
  • Risk Management
  • Social Trading
  • Technical Analysis
  • Top World Traders
  • Trading Apps
  • Trading Psychology
  • Uncategorized
Tags
Acquisition AI Amazon Apple Artificial Intelligence Bitcoin bond yields CEO China earnings earnings report economy Electric Vehicles Federal Reserve financial performance Financial Results forex ea forex software reviews Growth Guidance Housing Market inflation interest rates Investing investment Investors Market Volatility merger mortgage rates net profit Nvidia Oil prices Q2 Results revenue Revenue Growth Sales sales growth Stock Futures stock market stock performance Stocks strategies technology Tesla Video
  • Terms of Use
  • Privacy Policy
  • Compensation Disclosure
  • Risk Disclosure
  • About Us
  • Contact Us

Copyright © 2023 by ForexEzy.com

No Result
View All Result
  • Top Forex Advisors
    • Best Forex Robots
    • Best Forex Signals
    • Best Managed Accounts
  • Top Forex Brokers
    • Best Forex Brokers
    • US Forex Brokers
    • UK Forex Brokers
    • MT4 Forex Brokers
    • MT5 Forex Brokers
    • Zero Spread Brokers
    • Best PayPal Brokers
    • TradingView Brokers
    • Social Trading Platforms
  • Top Review Platforms
  • Forex Education
    • Getting Started
    • Forex Basics
    • Forex Trading Strategies
    • Money Management
    • Risk Management
    • Technical Analysis
    • Fundamental Analysis
    • Trading Psychology
    • Social Trading
    • Automated Trading
  • Forex Tools
    • Forex Robots
    • Forex Indicators
    • Forex Signals
    • Forex VPS
  • Forex Forecast
  • Crypto
    • Best Crypto Exchanges
    • Best Crypto Bots
    • Crypto Guides & Forecasts

© 2023, Forexezy. {copy} {year}