Being in its teenage years, the cryptocurrency market is relatively new as compared to other financial assets. To that end, investors and analysts in the industry are still developing tools and instruments to help predict this highly volatile market. When it comes to technical analysis, most tools used in traditional financial markets are applicable to crypto. For fundamental analysis, however, the tools used tend to differ to some degree. One such tool is the fear and greed index, or the FGI in short.
About the FGI indicator
The concept of measuring investor fear or greed is not native to the crypto market. CNNMoney has a similar FGI for measuring these sentiments among stock traders. This was perhaps the inspiration that led to alternative.me creating the crypto FGI indicator.
Generally, indices take multiple data points and turn them into a single statistic. As an indicator, the FGI serves to measure the overall sentiment of the participants in the crypto market. This can shed light on whether it is a good time to invest or liquidate your positions.
How can telling the market sentiment help to inform your trade decisions? Well, traders, like any other multitude of people, are driven by emotion. When the market is rising, people tend to get greedy. If they had not invested in the rallying asset, the fear of missing out (FOMO) drives them to buy into it, without regarding that they may be buying the peak. A high level of greed may indicate that the market is due for a correction in the near future. A correction refers to a drop in prices by around 20%.
Conversely, when the market starts trending down, the natural reaction is fear among investors. Those of weak conviction, who, let’s face it, are the majority, will start selling off their assets, causing an even further plunge in prices. Therefore, extreme fear can be taken as a sign to buy low. Like Warren Buffet famously said, be fearful when others are greedy, and greedy when others are fearful.
How it works
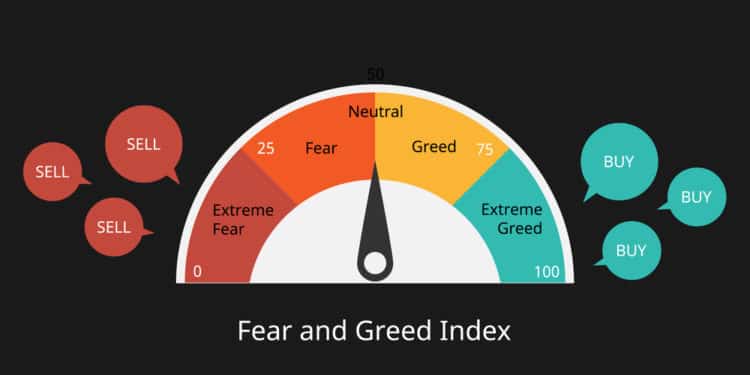
Alternative.me, the creators behind the FGI, usually analyze several metrics of the leading cryptocurrency, Bitcoin. These numbers are crunched to form the fear and greed index, which can be used to trade this market leader as well as other altcoins. The results are displayed on a scale of 0-100. The lower end of the spectrum indicates fear, while the higher end represents greed. More specifically, the index’s scale can be interpreted as follows:
- A reading of 0-24 is indicative of extreme fear.
- 25-49 shows moderate fear among investors.
- 50 is neutral, a homeostatic balance between fear and greed.
- 51-79 indicates moderate greed in the market.
- 75-100 shows extreme greed levels.

At press time, Bitcoin, along with most altcoins, has been in a downtrend for the last several months. The scale reads extreme fear, with the number dwindling as the bearish trend persists. For investors looking to buy the dip, this may be an ideal opportunity.
Components of the FGI
The six factors that collectively make up the FGI are listed below.
- Volatility
This is a comparison of the current BTC price movements and maximum drops to the average values of the same over the last 30 and 90 days. Any extraordinary increase in volatility is interpreted as an indication of fear in the market. This makes up a quarter of the index.
- Market volume/momentum
This measures the daily BTC trading volume and momentum and again compares it to the average values over the last 30 and 90 days. If the market displays increasing daily volumes, it is taken as a sign of greed. Again, this metric constitutes a quarter of the index.
- Social media
This metric measures the amount and frequency of chatter surrounding Bitcoin hashtags on Twitter. A higher interaction rate shows a growing public interest in cryptocurrency, which goes to show investors are greedy. This accounts for 15% of the FGI.
- Dominance
Dominance refers to the market cap share of Bitcoin as a proportion of the entire crypto market cap. If the BTC dominance rises, it shows investors are angling toward the “safe haven” cryptocurrency. A reduction in its dominance shows that investors are getting greedier and venturing towards riskier altcoins. This metric accounts for 10% of the index.
- Trends
This metric gauges the search queries related to Bitcoin that are posted on Google. For instance, a rise in searches of “Bitcoin price manipulation” indicates that investors are fearful. This accounts for 10% of the index.
- Surveys
The good people at alternative.me conduct weekly polls on their affiliate polling site, strawpoll.com, asking people their views on the market. This attracts quite a number of votes, which they use to gauge the overall market sentiment. Usually, this makes up 15% of the index. At the moment, though, the surveys component has been paused.
Advantages of the FGI
- It helps gauge investor emotion so you don’t fall into the trap of emotional trading.
- It helps better time your trade entries and exits.
The FGI and long-term analysis
For all its bells and whistles, the FGI is just a single data point. To that end, it is not entirely sufficient as a standalone indicator. More to the point, it is not suitable for informing long-term trades; for one, it is a lagging indicator. Secondly, market sentiment can be quite fickle, and random black swan events can trigger a significant change in this metric. Therefore, the FGI should be used in conjunction with other market indicators for best results.
Summary
The FGI is an indicator used to gauge the overall sentiment of Bitcoin investors. This can be used to trade Bitcoin or any other altcoin in the market. The index’s scale reads from 0 to 100, with the lower end of the spectrum indicating fear and the higher end displaying greed.


