
Indicators are useful mathematical tools widely used by trading technicians to predict the direction of a financial asset. These indicators are made or formulated using a combination of several mathematical calculations. This piece will look at what breadth indicators are and how to use them in forex investing.
Classification of trading indicators
These tools are classified in several ways. In general, there are two main types of indicators in the financial market. We have leading indicators, which are forward-looking tools that attempt to predict what will happen in the future. Second, there are lagging gauges that use historical data and trail the direction of the financial asset. Examples of these lagging indicators are moving averages and Bollinger Bands.
These indicators are then put into another category based on their goals. These categories are:
- Trend – They follow the trend and are useful in predict a change in direction. They include Bollinger Bands, moving averages, and Ichimoku Kinko Hyo.
- Oscillators – These are leading indicators that attempt to explain the momentum of a financial asset. In most cases, they have an upper level to denote overbought conditions and a lower level that denotes an oversold level. Others like the MACD have a middle line.
- Volume indicators – These are indicators that include the concept of volume in their calculation. Examples of these are the money flow index (MFI) and the accumulation and distribution indicator.
The other popular type of indicator that is most common in stocks and indices trading is known as breadth. We will look at what breadth indicators, how they work, and some examples.
What are breadth indicators?
Breadth indicators are technical tools that seek to provide the overall view of the stock market. They achieve this by looking at several things like the number of stocks that are rallying or those that are falling in a certain duration.
Other indicators look at the volume of these stocks while others look at a combination of volume and the number of stocks that are rising or falling. Therefore, in most cases, breadth indicators are usually used in stocks trading and are not necessarily useful in analyzing other assets like cryptocurrencies and commodities. For a complete guide on these indicators, we recommend that you lead a book known as Market Breadth Indicators by John Murphy.
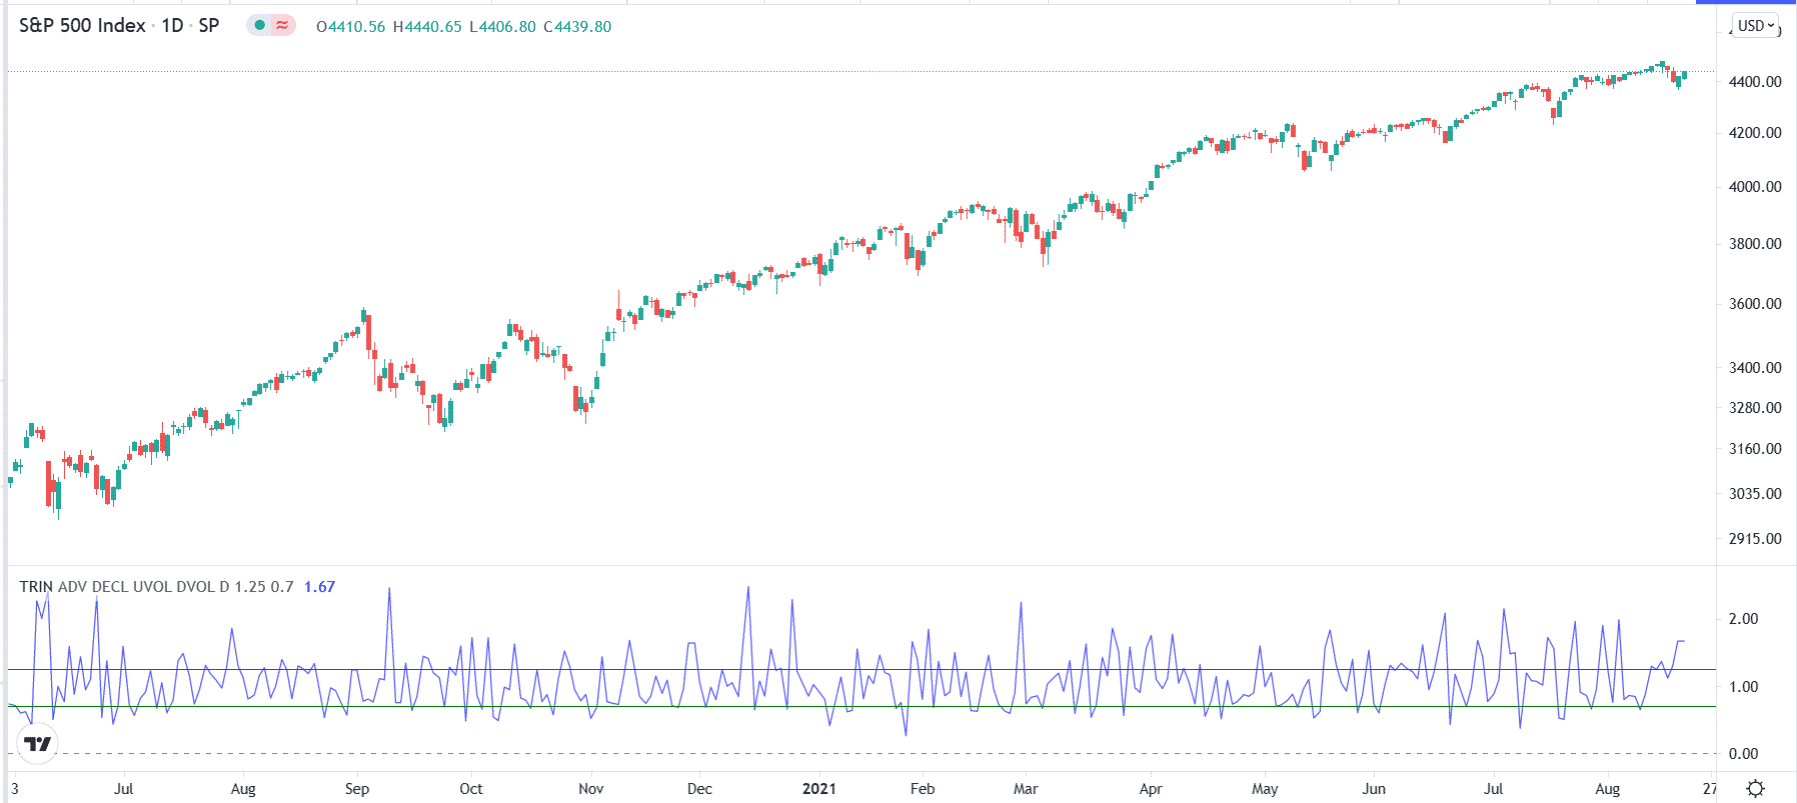
Arms Index
The Arms Index is a tool that looks at the concept of the advance-decline ratio (ADR) and the advance-decline volume ratio. It is calculated in a relatively easy way, where you look at the number of stocks that rose for the day and those that declined.
You then look at the total volume of the stocks that rose and those that declined. Finally, you divide the two and come up with your arms index. This data is derived from data providers for popular indices like the Dow Jones and the S&P 500 index.
The indicator is also commonly known as TRIN. When applied on a chart, the indicator is usually shown as a single line that moves up and down. It also has upper and lower levels that show overbought and oversold levels.
In theory, when the Arms Index rises substantially above the overbought level, the situation is usually said to be overbought. When it drops below the lower line, it is usually a sign that the index is getting oversold.
The arms index can also be used to trade divergences. A divergence happens when the indicator is on an upward trend while the financial asset is falling and vice versa.
Arms index on the S&P 500 chart
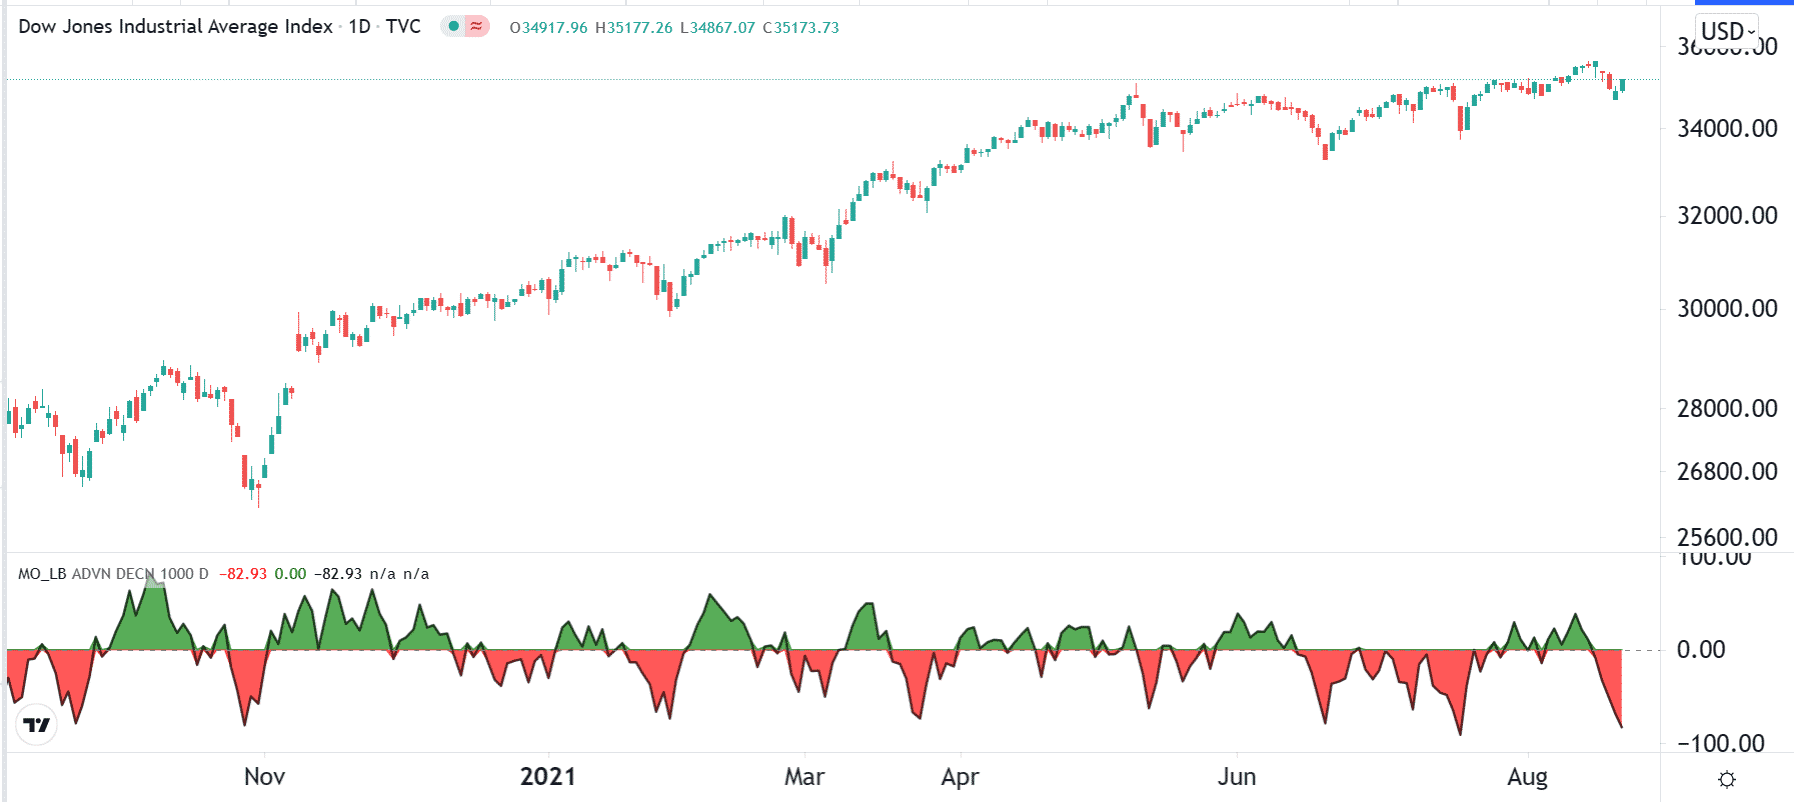
McClellan Oscillator
The McClellan Oscillator a famous breadth tool in the market. It was created by a father and daughter duo of Sherman and Marian McClellan. When applied to a chart, the indicator has a close resemblance to the MACD. Indeed, the indicator is often viewed as the MACD of the ADL line.
The MO calculation is relatively complicated. The process starts by calculating Ratio-Adjusted Net Advances (RANA). This is calculated by first finding the number of advancing and declining stocks in an index. You should then subtract the declining ones from the advancing ones. Then, you should add the advances and the declining and then you divide the two.
The MO is then calculated by subtracting the 39-day EMA of RANA indicator from the 19-day EMA of RANA.
Using the indicator is relatively easy. In most cases, when the indicator is above the neutral line and indicating green color, it is usually a bullish sign. A bearish sign emerges when the indicator has a red color and is below the neutral line. Still, the main challenge of using the indicator is that it often shifts to a red color at times during a bullish trend as shown below.
McClellan Oscillator on the Dow Jones chart
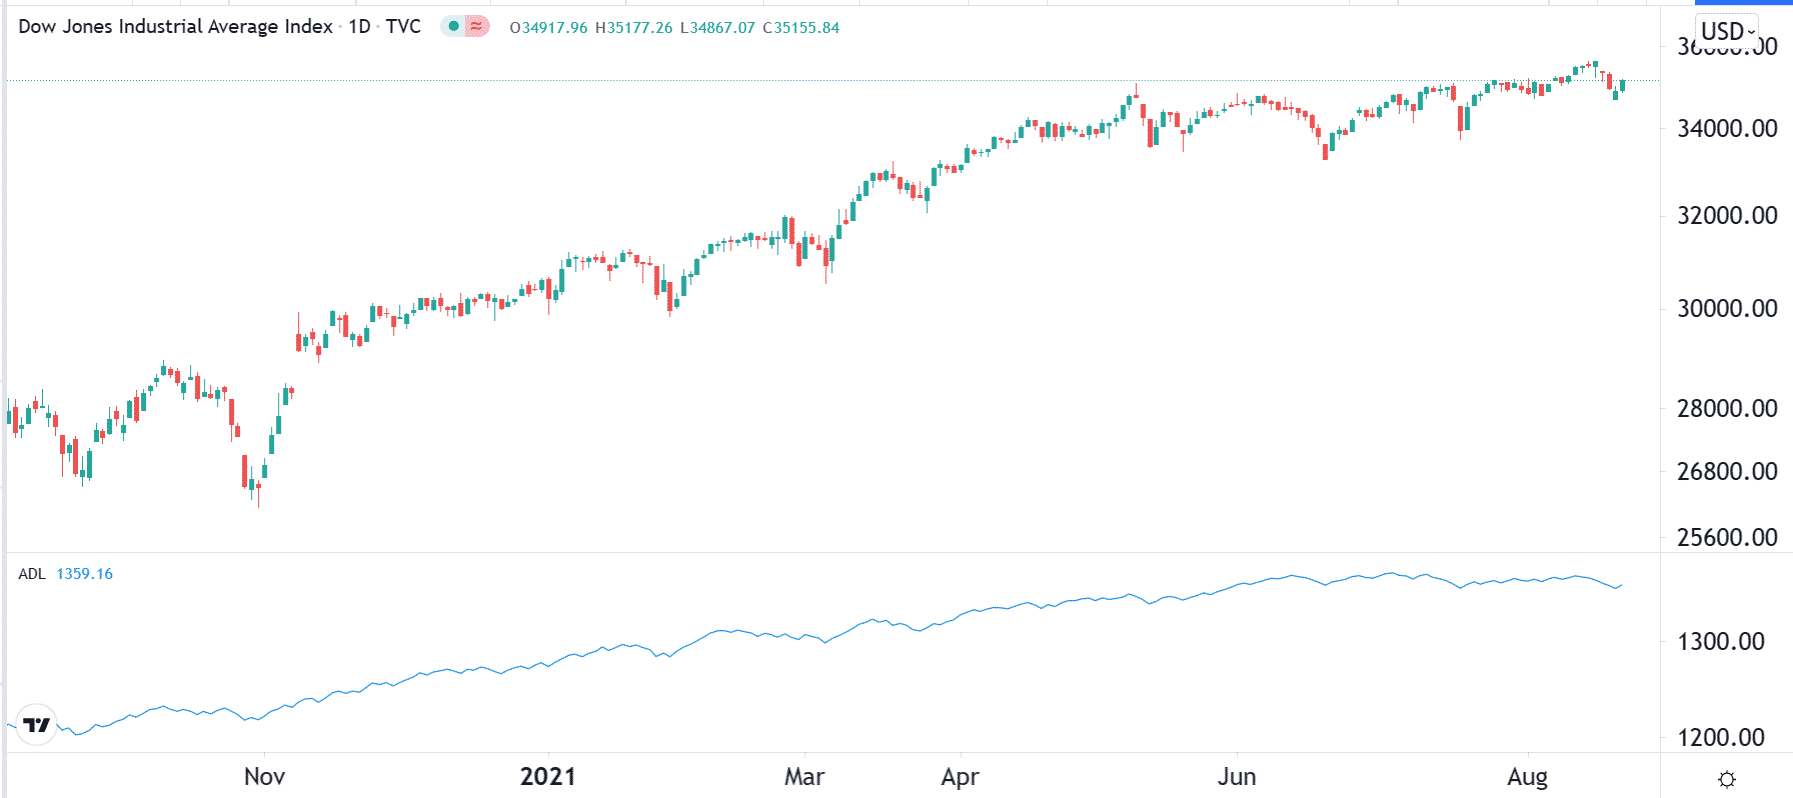
Advance-Decline Line (ADL)
The ADL line is a breadth tool that looks at the number of soaring stocks and those that are retreating. In this, you subtract the number of gaining equities less that of the sliding ones. As a result, the indicator rises in a bull market because the number of rising stocks is more than that of the falling ones. The vice versa is true. When applied in a chart, the ADL line is shown as an individual line that has no upper and lower limit.
The ADL line does not provide buy and sell signals and is awful for most day traders. Instead, the indicator is only used to show the sentiment of the market. For example, when it is falling while the index is rising, it can be a sign that the rally is about to come to an end. The chart below shows the ADL line applied on the Dow Jones chart.
ADL chart on Dow Jones
McClellan Summation Index (MSI)
The MSI indicator was formulated by the same duo that created the second oscillator mentioned above. In fact, the concept of the MSI is similar to that of the MO indicator. When applied in a chart, it is a line that fluctuates above and below the zero line.
The MSI indicator is calculated by adding the previous day’s summation index and the present day McClellan oscillator. In most cases, the oscillator remains above the neutral line during a bull market. It then tilts below the neutral line when the index starts showing some weakness.
Like other breadth indicators, the MSI indicator is not effective for day traders. Instead, only long-term investors find its value because it tells them the overall sentiment in the market.
MSI applied on the S&P index

Summary
Breadth indicators are relatively popular tools that provide sentiment about the stock market. In this article, we have looked at what they are and identified four of the most popular ones. Still, there are others that we have not looked at including the Eakle Advance-Decline Index, Absolute Breadth Index, and the Merriman NYSE Volume.


