Candlesticks are the most popular types of charts used in the market today. They are better than line charts, bar charts, and area charts. That is because they give more details about the performance of a currency pair, stock, and commodity.
A candlestick is made up of a body and two shadows. The body represents the range of the session’s opening and closing price. The highest point of the upper shadow is the session’s high while the lowest point of the candlestick is the session’s lowest level. In a daily chart, a single candlestick represents a single day while in a four-hour chart, a single candle represents every four hours of the session.
Bearish and bullish candlesticks
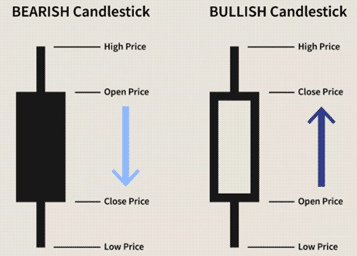
Candlestick analysis is the process of looking at patterns that emerge from these candlesticks. The process is useful in both technical analysis and price action trading strategies. In most cases, they are used to identify a reversal in the market. In this report, we will look at the five most common candlestick patterns in forex.
Engulfing Candle
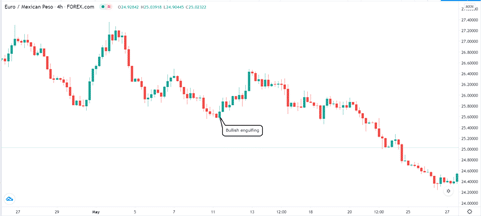
Engulfing patterns are popular candlestick formations that help traders identify reversals. For starters, a reversal is where a bullish trade reverses and turns bearish and vice versa. A bullish engulfing happens when a financial asset is in a downward trend. The pattern happens when a bullish candle fully covers a previous bearish candlestick.
Three things need to be in place for a bullish engulfing pattern to form. First, the asset needs to be in a visible downward trend. Second, the second real body of the asset must completely cover the previous bearish body. Finally, the second candle must be of the opposite colour.
Bullish engulfing pattern example
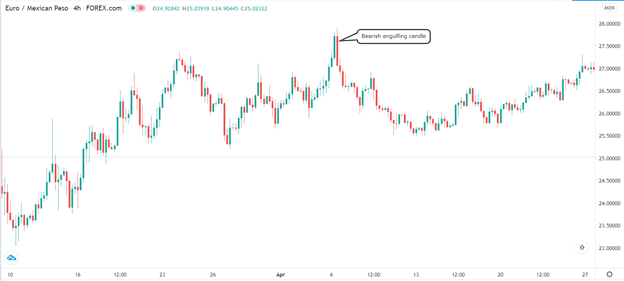
A bearish engulfing pattern is the exact opposite of a bullish engulfing pattern. It happens when an asset is in a strong upward trend. A bigger bearish candle usually follows – and covers – the bullish candle. A good example of this formation is shown in the chart below.
Bearish engulfing pattern
Hammer and Inverted Hammer pattern
A hammer is one of the most popular candlestick patterns. Like the engulfing, it usually signifies that a reversal is about to happen.
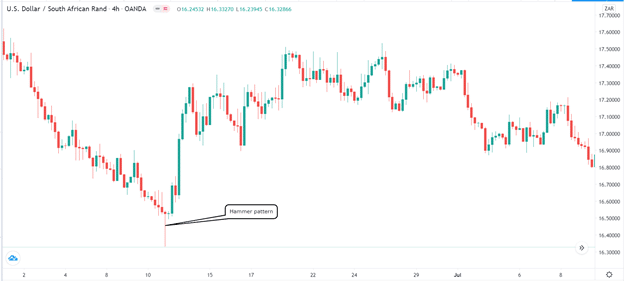
A hammer candlestick resembles a real physical hammer. It has a small body and a long lower shadow that forms at the end of a bearish trend. The pattern usually means that the price has dropped to a new low but more buyers are returning. In most cases, the lower shadow needs to be at least double the size of the body. The hammer should not have an upper shadow. If it has, the shadow needs to be very short.
A hammer pattern is usually more accurate when it has a very long lower shadow and a relatively small shadow. At the same time, the colour of the shadow is usually not very relevant.
Hammer pattern example
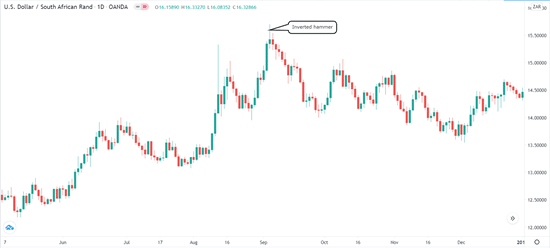
The opposite of a hammer pattern is an inverted hammer. It is formed during an upward trend and is characterised by a small body and a long upper shadow. Like the hammer, it does not need to have a lower shadow. When it does, the lower shadow needs to be relatively small as shown below.
Inverted hammer example
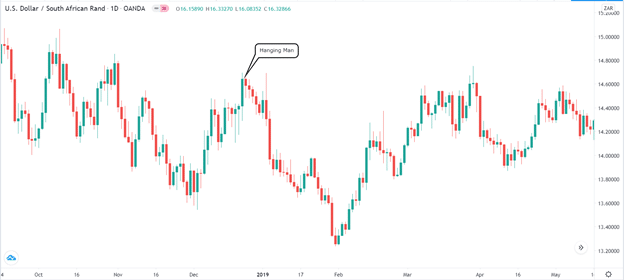
But a hammer pattern can also occur during an uptrend. In this case, the pattern is known as the hanging man and is also a signal that a bearish trend is about to start.
Hanging man pattern
Dark-cloud candle formation
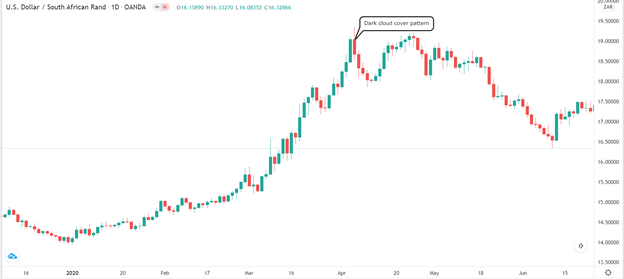
A dark-cloud cover is a bearish reversal pattern that happens after a strong rally. The candlestick pattern has two opposite-coloured candlesticks. It happens when a currency, stock, or commodity that is in an upward trend opens higher.
The second candle then opens higher, sending a signal that the pattern will continue. But then, the rally loses steam and the price ends slightly below the bullish candle. When this happens, bulls start to question whether the upward trend will continue, bringing more downward pressure. This pattern is shown in the USD/ZAR pair below.
Dark cloud cover pattern
The opposite of the dark cloud cover is known as the piercing pattern. It is a bearish reversal pattern that happens at the bottom of a downward trend.
Morning star candlestick
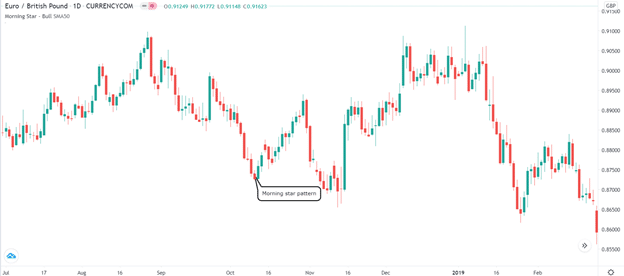
A morning star is a bearish candlestick pattern that signals that a steep downward trend is about to reverse. It is made up of three candles. The first candle is usually a large bearish one that signals that more bears are piling-in. It is followed by a small bearish candle, often without an upper and lower shadow. Finally, this candle is followed by a large bullish candle and a series of higher highs and higher lows. The idea behind the means that sellers start to lose their capacity to push the price lower.
An example of the morning star pattern is in the EUR/GBP pair below. As you can see, the price was previously in a downward trend. A large bearish candle happened before the small bearish candle. It was then followed by two bullish candles.
Morning star candle example
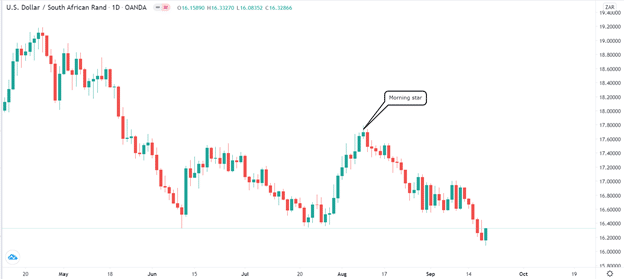
The opposite of a morning star pattern is known as the evening star. It is called so because, the planet Venus (also known as the evening star), usually comes before darkness. The evening star usually sends a sign that a bullish trend is coming to an end. For it to happen, there needs to be a strong bullish candle followed by a small – often shadowless – bullish candlestick pattern. It is then followed by a bearish candlestick. An example of the evening star pattern is shown below.
Evening star pattern
Harami candlestick
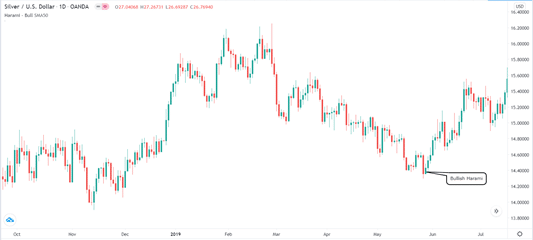
Harami is a reversal pattern that is eerily similar to an engulfing pattern. A bullish harami happens when a large bearish candle is followed by a small bullish candlestick. This is the opposite of a bullish engulfing pattern, which happens when a bigger bearish candle is engulfed by a big bullish candle. The harami usually sends a message of the disparity or uncertainty in the market.
Bullish Harami example
Summary
Candlestick patterns are very useful for all traders. They help them in both technical analysis and in price action strategies. The easiest way to use them in trading is to take time to learn about their history. It will introduce you to all types of patterns we have mentioned and others like windows, doji, and the three mountains.


