- The average hourly earnings report for June 2021 (YoY) failed to beat estimates by 0.1%
- US manufacturing payrolls declined 61.54% from 39,000 to 15,000 in June 2021.
- Canada increased their rates of capacity utilization to 81.7% in Q1 2021 from 79.7%.
The USDCAD pair lost 0.87% on July 2, 2021, from the previous day’s close. It opened trading at 1.2437, reached a high of 1.2451 before closing at a low of 1.2328.
The average hourly earnings report for June 2021 (YoY) indicated a 3.6% drop (0.1%), less than consensus estimates at 3.7%.

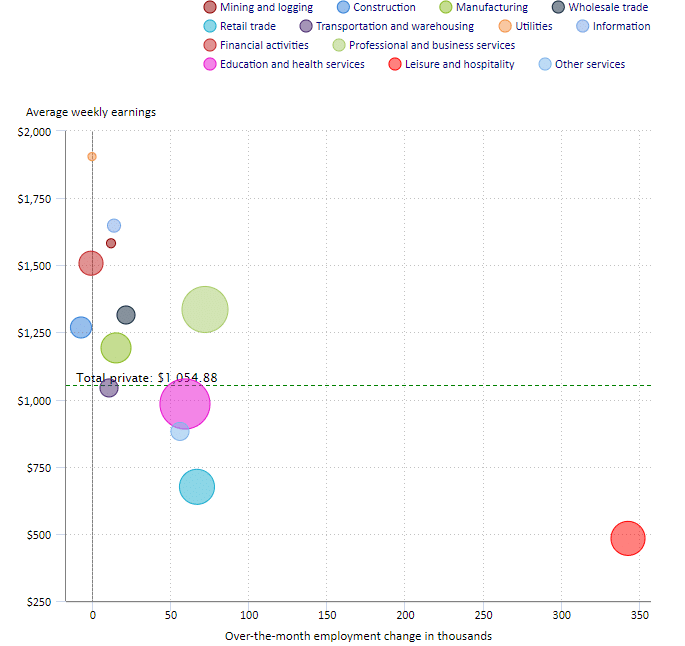
Weekly earnings chart (by industry)
The mean hourly earnings in the previous record (for April 2021- YoY) stood at 1.9% showing the increase in US hourly earnings from the start of the pandemic.
Monthly hourly earnings (on average) fell 0.3% from a previous record of 0.4%. While the utility industry had the highest average hourly earnings at $44.61 in June 2021, it fell 0.19% on mean weekly earnings.
June 2021 also saw manufacturing payrolls decline 61.54% from 39,000 to 15,000. It failed to beat estimates at 28,000. The unemployment rate rose slightly at 5.9% from a previous record of 5.8%. However, the month also saw an increase in the nonfarm employment numbers from 583,000 to 850,000. Private nonfarm payroll (for June 2021- MoM) also increased from 516,000 to 662,000, indicating increased employment in both government and private industries.
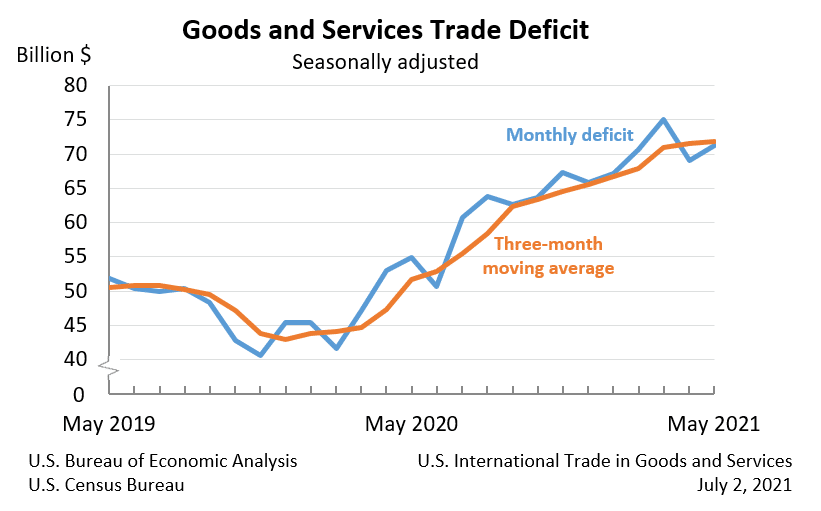
The sale of passenger cars in the US declined to 3.56 million in June 2021 from a previous record of 3.99 million. Truck sales in the same month also fell 15.16% from 13.06 million to 11.80 million, showing a drawdown in demand. Nevertheless, there was a positive decline in the trade balance deficit to $71.20 billion from a consensus estimate of $71.40 billion.

US trade deficit (May 2021)
The increase in imports to $277.3 billion (+0.6%) against exports at $206.0 billion (+0.6%) caused the trade deficit to increase (3.1%) from $69.10 billion in April 2021 to $71.20 billion in May 2021. The deficit in goods trade surged 2.64% (+$2.3 billion) from $86.9 billion in April 2021 to $89.2 billion. The surplus in the service industry also rose 0.56% to $17.9 billion in May 2021 from a low of $17.8 billion.
Commodity price in Canada
The Canadian dollar was uplifted by the rising oil prices that saw the commodity top $76.00 per barrel in the week ending on July 2, 2021. This week, however, saw the CAD drop 0.28% against the US dollar, especially after the trade balance report.
Canadian imports rose against exports driving the trade balance to -CA$1.39 billion from CA$0.46 billion. While the manufacturing PMI for June 2021 (MoM) tanked to 56.5 from a high of 57.0, it remained in the expansionary zone.
Q1 2021 saw industries in Canada increase their rates of capacity utilization to 81.7% from 79.7% realized in Q4 2020. This increase was attributed to the rise in the extraction of oil/ gas, construction, and mining activities.
Technical analysis
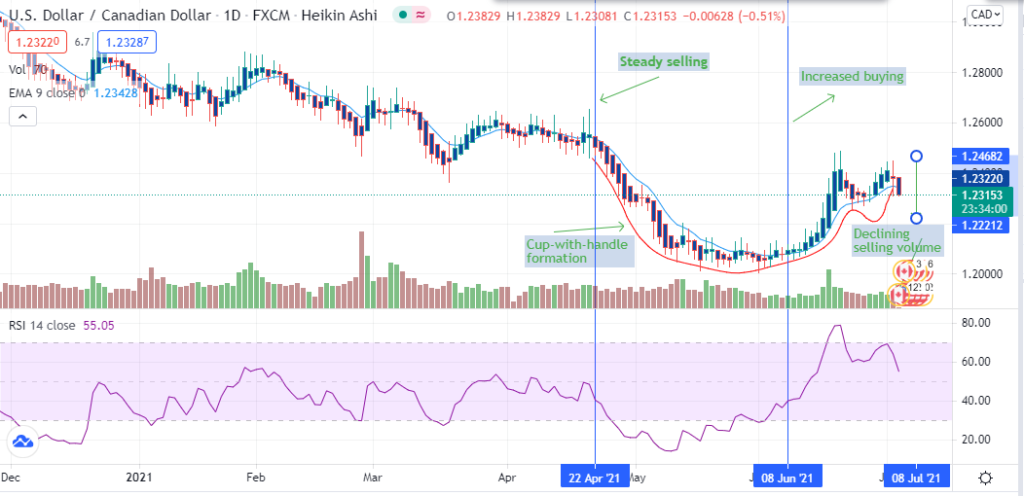
The USDCAD pair formed a cup with handle pattern, signaling an incoming upward breakout. It stood above the 9-day EMA that was at 1.2343.

In response to the pattern, the price could reverse upwards towards 1.2468. If it rejects the upper border of the cup with handle formation, the pair may continue the bearish trend to 1.2221.
Steady selling of the pair took place from April 22, 2021, before it was replaced with an increase in buying from June 8, 2021. There was a decline in the selling volume as the pair’s price fell to 1.2322. Decreased selling momentum was supported by a higher 14-day RSI at 55.05.


