Although money cannot purchase pleasure, there is frequently a link between economic opportunity and personal well-being. After all, if you can’t buy basic necessities, find work, or get a loan, you’re not going to be very happy. Bitcoin trading is conducted with a CFD trading account to speculate on price movements or use an exchange to buy and sell the underlying currencies. Transaction risk, interest rate risk, leverage risk, counterparty risk, and nation risk are all risks that investors face when trading. BTC trading can cause happiness or misery. Finding a precise definition of happiness or sorrow can be challenging. This is when the misery index comes into play.
History of the misery index
The original misery index, known as the Economic Discomfort Index, was simply the sum of inflation and unemployment rates. It was created by Arthur Okun, an economist on President Jonhson’s Council of Economic Advisers, so the president could receive a quick report on how the country was performing. It gained popularity in the 1970s and became a discussion subject for journalists and presidential candidates during elections.
In 1999, Harvard economist Robert Barro devised the Barro Misery Index (BMI). He also included two additional variables: interest rate changes (based on long-term government bond yields) and GDP growth rate. He explained that something that reduced misery was economic prosperity.
Hanke produced his own improved misery index in 2011. The indicator, later called Hanke’s Annual Misery Index (HAMI), considers unemployment, inflation, and bank lending rates to be negative. He explained that it makes you more miserable if getting credit is more difficult and you have to pay more for it. It adds to the difficulty of life. The HAMI can be applied anywhere in the world, and Hanke publishes an annual table of the misery index scores for various countries. There are other types of misery indexes that have also been created in the past.
What is the BMI?
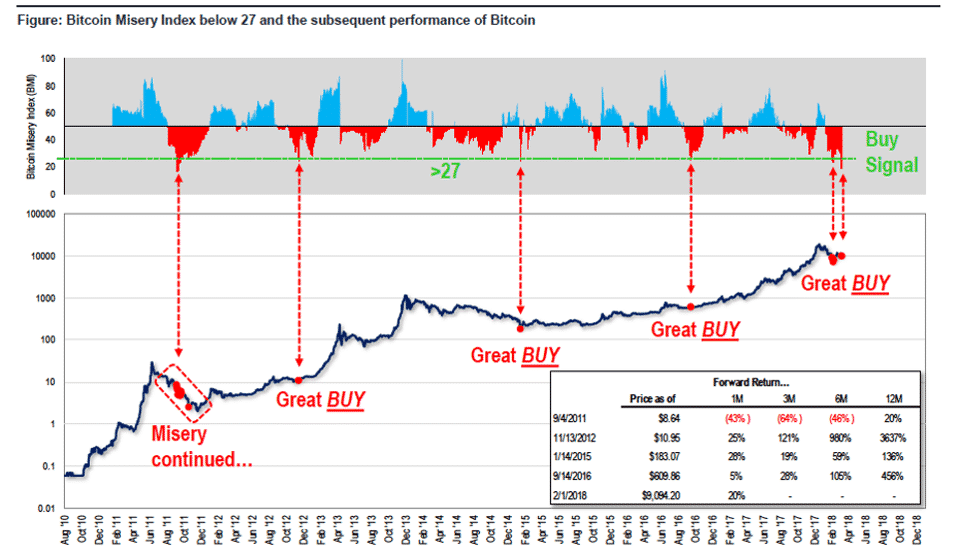
The BMI was developed in early 2018 by Thomas Lee. Lee has also worked as a Wall Street analyst for nearly three decades. The BMI, according to Lee, is a method of determining how happy or sad bitcoin investors are based on market prices.

The BMI is based on a contrarian investment technique that focuses on buying assets when most others are selling them and selling them when demand is high, and prices are rising. The BMI, like the Relative Strength Index (RSI) for stocks, indices, and commodities, illustrates oversold and overbought circumstances.
How does BMI work?
Bitcoin’s high risk and speculative nature attract investors who can swiftly analyze price changes and grasp the implications of news announcements, then place buy or sell orders accordingly. When the BMI index falls below a certain level, less sophisticated investors may be tempted to buy bitcoin without first considering other factors that may influence pricing. It’s possible that a large portion of the growth in bitcoin demand since 2016 has come from less experienced investors.
The index is computed by subtracting the number of winning trades from the total number of trades (% of days in which Bitcoin is up), as well as measuring volatility (upside less downside). When the indicator is low, it is the optimum time to buy. When the indicator is high, it is the optimum time to sell.
When the BMI is low, it indicates that people are “miserable,” which is defined as a BMI of less than 27. According to Lee, people are “so miserable” right now that Bitcoin is performing well and is a good time to invest. When the number rises above 67, it indicates that individuals are becoming optimistic and, as a result, it is a signal to sell BTC in anticipation of a collapse.
Those that rely entirely on BMI as a trading signal frequently rushes into buying or selling and afterward regret their decision. It’s vital to consider all potential price influences.
RSI and MACD relation to BMI
The BMI is calculated in the same way that analysts use the Relative Strength Index (RSI) or Moving Average Convergence/Divergence (MACD) to evaluate whether an index is oversold or overbought. When the reading is below 30 for the RSI, it shows an oversold condition. When the value is above 70, it indicates an overbought condition. When the MACD crosses over the signal line, it indicates that the market is oversold, while when it is below that line, it indicates overbought conditions.
Because Lee has accumulated some additional data to go along with his research, his BMI index may be more useful than the usual RSI and MACD indicators for Bitcoin. Also, because Bitcoin’s price was relatively low until 2017, RSI and MACD may not be as accurate as they are when applied to securities with a longer track record. They can, however, be used to supplement BMI.
Limitation of BMI
- It cannot predict when a big crypto exchange will be hacked.
- It doesn’t accurately picture how new government rules or regulations, such as those imposed by the SEC, might affect bitcoin’s price.
Summary
Tom Lee created a misery Index that lets traders know how miserable Bitcoin investors are based on current prices. There have previously been a number of misery indices, the first of which being Arthur Okun’s Economic Discomfort Index. When a person’s BMI is low, it means they are “miserable,” which is defined as a BMI of less than 27; therefore it is a good time to buy BTC. When the figure exceeds 67, it suggests that people are becoming more hopeful, which is a signal to sell BTC. Like any other index, it has limitations.


