Volatility is one factor determining the extent of profits and losses. The best financial market has to produce significant gains, which is only possible through noticeable price changes or increased volatility.
The forex markets are constantly going through periods of low and high fluctuations. These are occurrences analysts observe to understand the current market conditions and anticipate new moves.
This article will explain what volatility is, why it’s important, and some of the most well-known indicators traders use in this regard.
What is volatility in forex?
Volatility is a measurement of the magnitude of price changes or fluctuations in a particular market over a defined period. When a forex pair has low volatility, we expect it not to move as fast, usually staying in range-bound conditions.
If volatility is high, we should anticipate a market to cover a greater distance and move in one direction for an extended period. We can sometimes characterize an unpredictable market by high volatility.
Examples of these moments are during high-impact news releases where we see spikes, gaps, and other erratic price movements because of the overwhelming buying and selling interest.
In normal market conditions, volatility is actually necessary for any trader to make a profit. A desirably large move is only possible if the price changes a significant enough distance. Therefore, traders observe volatility to forecast the magnitude to which price could potentially change.
Volatility is usually high when there is low liquidity; inversely, volatility is low when there is high liquidity. Generally speaking, volatility in major and minor pairs is a lot smoother than in thinly traded markets, namely exotic pairs, which can sometimes move erratically.
Although many like to believe forex is a so-called highly volatile instrument, in reality, this market mostly moves in less dramatic increments, a stark contrast to something like cryptocurrencies.
Why is volatility important?
Understanding volatility is vital for a few reasons.
Knowing the best markets to trade and trading costs
Low volatile forex pairs include the likes of EUR/USD, USD/JPY, etc. that are highly liquid because of the volume of daily transactions they boast in foreign exchange.
Due to competition, the costs of engaging with it are low. Suppose more people are trading a particular market. It isn’t to say such pairs are never highly volatile, but it is not in the same magnitude compared to other instruments.
Markets that are generally highly volatile are primarily exotics like USD/ZAR, GBP/SEK, EUR/NOK, and many others. These are thinly traded currencies, meaning the spreads are typically a lot higher than with majors or minors.
However, their volatility can rise significantly above that of their counterparts and could provide more significant profits. Nonetheless, a majority of people stay away from exotics because of the spread, which is partly influenced by the volatility.
Popular markets enjoy a wider group of speculators, making them cheaper to trade.
Forecast the magnitude of moves
If we know that, for example, the market has moved 200 pips on the weekly time frame, we could assume it could at least cover this distance in the current week.
If it were not to cover this range, it might signal an opposite directional move could occur soon.
Most popular volatility indicators in forex
Compared to other indicators, there aren’t many popular options for analyzing volatility. Nonetheless, the tools below are the most useful:
Average True Range (ATR)
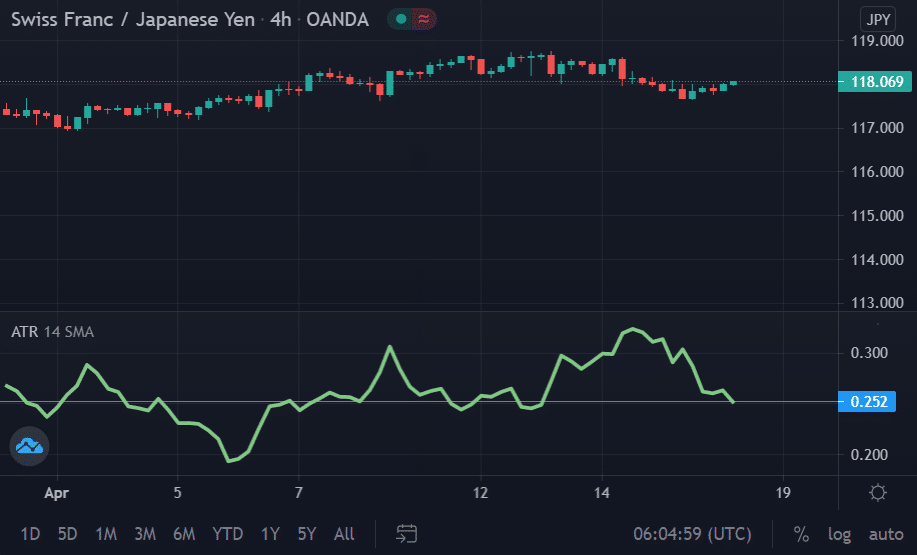
The ATR is a beneficial indicator and one of the most favored choices for dissecting volatility. Unlike many other tools, the ATR’s job is not to provide direction about price but reflect its range over a given time frame.
At first glance, the ATR may appear to be some form of oscillator. However, it merely is a moving average tracking the range a pair is moving over a specific period from the low to high.
The default setting is 14, which is the period (14 days). Fortunately, this figure is adjustable. Readings are the next component to know about the ATR. They refer to how many pips a particular pair has moved within a specific period from the high to the low price.
For instance, if we look at the 4hr time-frame of CHF/JPY in the image above, if the ATR shows 0.252, this means the pair moved an average of 25.2 pips in four hours. This information is beneficial when it comes to setting stop losses.
The ATR provides a guide in ensuring that, depending on the time frame, these orders are above that particular mark so that traders can withstand any fluctuations for longer.
Bollinger Bands
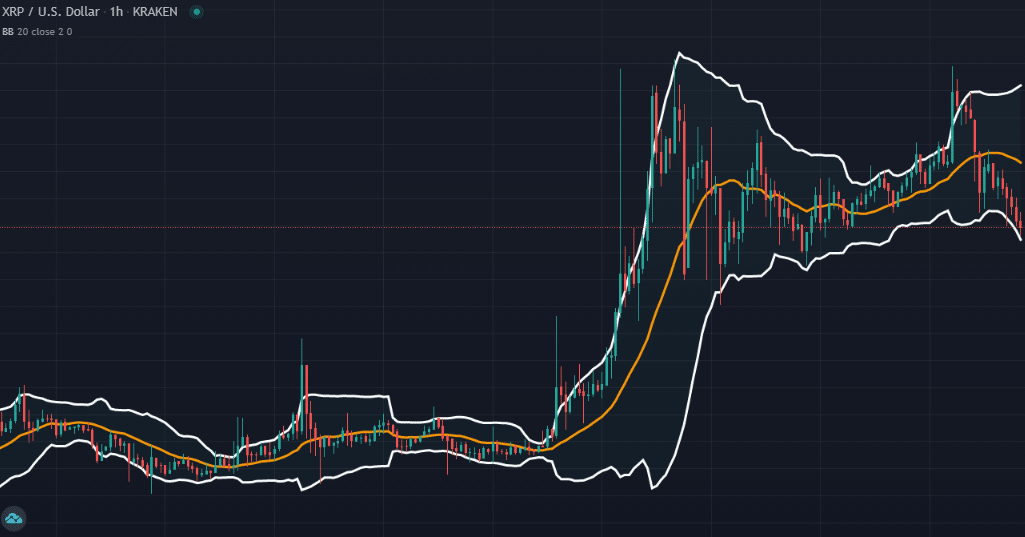
This indicator has a few purposes, one of which involves measuring volatility. Legendary financial and technical analyst, John Bollinger, created this tool. The indicator consists of three bands, two of which, the upper and lower, are standard deviations from the center band, which is a 20-day moving average.
With most trading platforms, this period and the number of deviations is adjustable. For measuring volatility, traders observe the contraction and expansion of the bands. In a low volatility pair, the bands will contract or squeeze, indicating a quieter period and a range-bound market.
When volatility increases, they will expand, signaling a busier, aggressive period with the market making new highs and lows regularly. In the image above, we can see both instances of contraction and expansion.
Similar to the ATR, some traders do use Bollinger Bands, not to provide a directional bias but only to measure volatility.
Final word
Markets are constantly going through cycles of stagnation and movement. Experienced traders should not consider volatility a bad thing because, without it, the profit potential is diminished.
When making entries, the desire is always to enter when the market is about to make a noticeable price change. Simultaneously, we should also know when certain pairs are quieter than usual and trade accordingly.


