
Every trader desires to know how many people are currently buying or selling in a particular market; this is where volume comes in.
Like any tool in forex, volume is subject to interpretation. Nonetheless, strategies dedicated to the best analyzing volume are plentiful. Therefore, it is helpful to have an introduction to the most popular volume indicators and some of the methods traders use.
What is volume?
There are several definitions for volume, but it really is a study of how much of an instrument has moved hands within a particular period. Volume is the fuel for every move we see on the charts. Some refer to it as supply and demand.
We characterize market strength with increased volume, while a declining one results from decreased volume. Any trader desires to enter positions when the volume is high or is about to increase rather than when it is stale and choppy.
If the volume of buyers increases, this is where we see a healthy and trending environment. When volume starts to decrease, it may be one of the first signals of a reversal. In this scenario, there would be less interest on one side and the possible accumulation of orders on the other.
Aside from there being specific volume indicators, this concept applies to other ideas of technical analysis like trend, supply, and demand, momentum, volatility, etc.
The challenge with analyzing volume in forex
Technically, for the average trader, accurately measuring volume is a difficult, if not an impossible, task because forex is decentralized. Unlike some stock and futures exchanges, there is no central order book where we can see the real contract volume of buying and selling interest at particular levels.
There are a few trading platforms and brokers with some form of order flow or sentiment indicator, but this only covers positioning from its clients, which is only a fraction of the entire forex market. Despite there being a plethora of so-called volume indicators, they are still heavily lagging.
Another issue is virtually all volume tools originated from stocks and commodities. So, even though we can observe the same concepts, most of these ideas aren’t so applicable to forex. Therefore, like any technical analysis tool, one should never use these in isolation.
Most popular volume indicators in forex
The following three are the most popular volume indicators in forex.
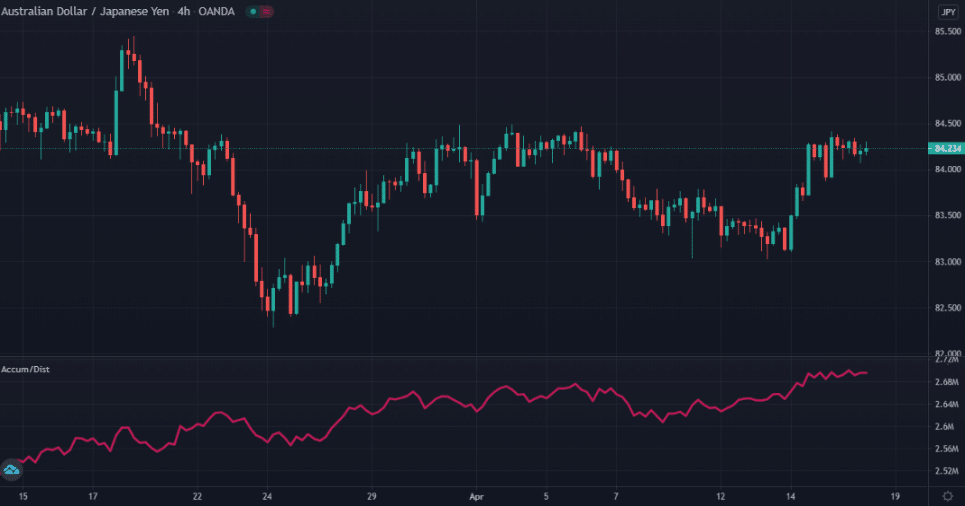
Accumulation/distribution index (A/D)
As the name suggests, this indicator attempts to show one where traders are accumulating (buying) or distributing (selling) a pair. Without going into its technical calculations, the A/D index shows us the running total of money flows derived from the open and closing prices.
The first principle of the A/D is identifying divergences between volume and price data similar to an oscillator. Divergence is the situation when the indicator moves in the direction opposite to price.
If the price keeps rising while the A/D index is falling, this could be one of the first signs of a reversal. The other purpose of this tool is to confirm the strength of a trend. Here, traders will observe the slope of the A/D and compare it to the market’s direction.
For instance, in a downtrend, the A/D line will appear to move downwards; the opposite is true.
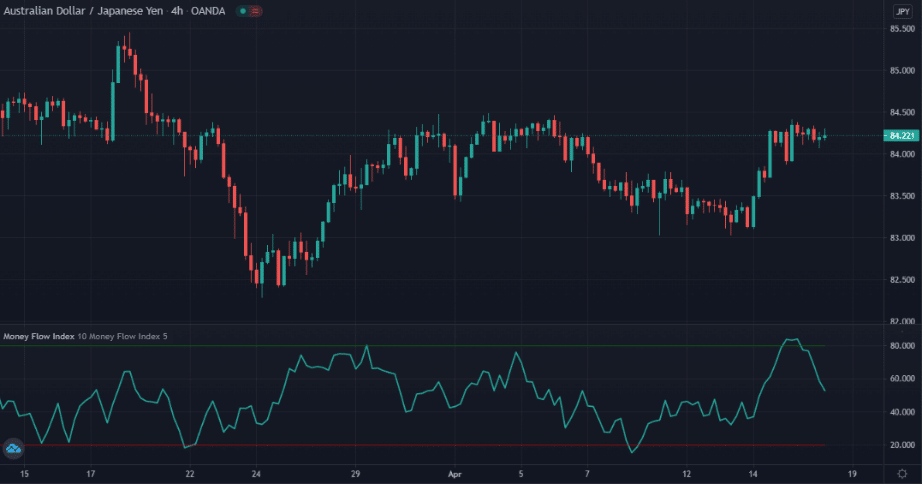
Money Flow Index (MFI)
The MFI has a comparable function to A/D. It is technically an oscillator because it constantly moves between two extremes, leading some to refer to it as the ‘volume-weighted RSI’ (Relative Strength Index).
The reason is, unlike its counterpart, the MFI also integrates volume instead of solely price. The MFI calculates the average of the high, low, and closing prices in a particular time frame and multiplies it by the daily volume.
There are few distinctions between the MFI and an oscillator like the RSI. It is a matter of personal taste over which one a trader chooses. Ultimately, both serve two functions — showing divergence and overbought/oversold conditions.
The MFI is a lot better at reflecting the latter than the A/D because of being an oscillator. With overbought and oversold, the MFI shows a form of line graph moving between 0 and 100.
We consider readings below 20 as oversold, signaling bearishness and the possibility of a retracement to the upside. Conversely, traders regard readings above 80 as overbought, suggesting bullishness and the chance of a pullback to the downside.
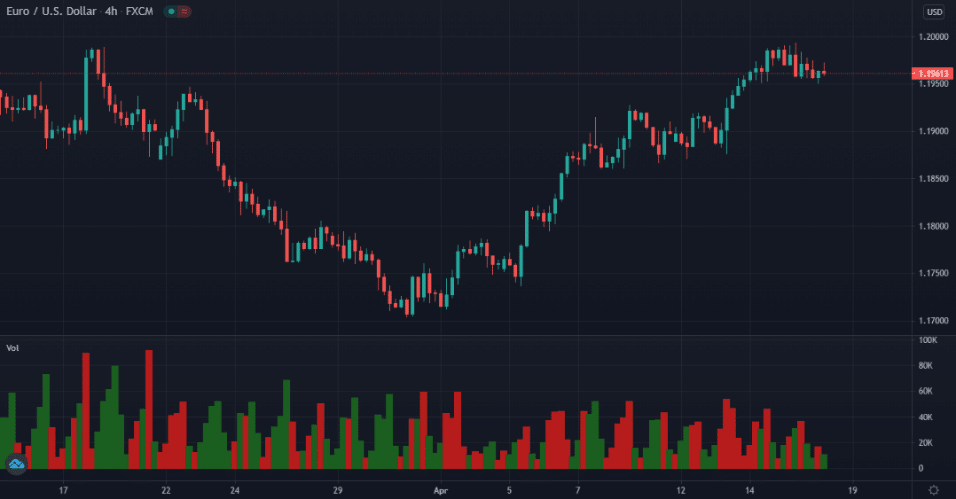
Volumes
This indicator measures the number of ticks the price has moved within a selected time frame. Several versions of this tool exist depending on the trading platform, but all operate on the same principle of showing the depth of volume for a particular session.
The indicator shows this through a histogram graph with green or red bars. A green bar signals an increase in volume, while a red one signals a decrease in volume. Each bar aligns with each session according to its time frame.
For instance, one individual bar on a 4hr time-frame will show whether volume increased or decreased within those four hours. One method traders could utilize this tool is by observing the changes between the bars.
If they were looking to go long, they would wait for a bar significantly higher than the previous one suggesting that volume is potentially increasing to the upside.
Final word
Technical concepts in forex all have similar challenges. Ultimately, the goal is the same, which is to figure out the magnitude of buying and selling pressure. However, whether someone uses trend, momentum, volatility, or support and resistance indicators, they all face the same difficulty as with volume of being lagging tools.
Excelling with volume indicators takes dedication and experience. The most important thing is to never use such tools on their own because they are not effective in this way.

