Andrews Pitchfork is a technical tool available in most charting tools like the TradingView and MetaTrader. It was developed by Dr. Alan Andrews, with the goal of identifying key support and resistance levels. The tool has three standard lines that can be drawn in all markets, including currencies, commodities, and stocks. In this report, we will look at what the Andrews Pitchfork is, how it differs with other pitchforks, and how you can use it to identify support and resistance levels.
What is the Andrews Pitchfork?
The Andrews Pitchfork is an essential tool that traders use to identify support and resistance points. For starters, a support is seen as a floor, where the price of an asset struggles to move below. A resistance, on the other hand, is a ceiling with the price fails to move above. By identifying these levels, traders can easily predict whether the price will have a reversal or whether it will have a continuation pattern.
There are several approaches to drawing support and resistance levels. The most basic one is to visually connects the lowest and highest swings of an asset. Another approach is to use the Fibonacci retracement tool.
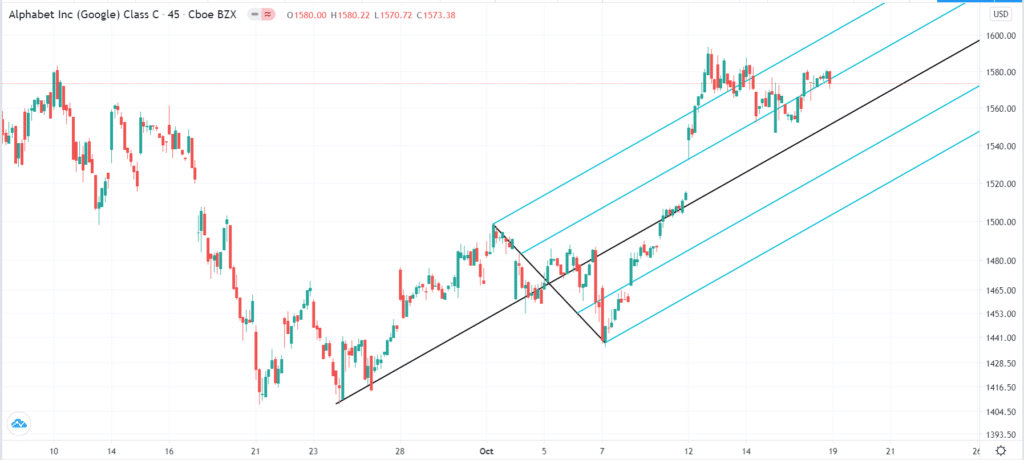
The Andrews Pitchfork is a tool, often used by experienced traders, to identify support and resistance levels. In its basic form, it has five lines. The one in the middle is known as the median line while the two upper ones are the resistance lines. Similarly, the ones in the bottom are the levels of support. The chart below shows the pitchfork drawn on the Alphabet chart.
Andrews Pitchfork example
How to draw the Andrews Pitchfork
Drawing the pitchfork is a relatively simple thing to do. The only caveat is that you should only draw the tool when the price of an asset is moving upwards or downwards. As you will find out, drawing it when the market is ranging or when it is moving sideways will not work.
The screenshot below shows the simple steps in which you can identify the pitchfork tool in the MetaTrader and the TradingView platforms.

After selecting the tool, you need to identify three key locations. The first one is the start of the median line, and is known as the pivot point. You should then select a significant higher swing of the asset and a significant lower swing. Finally, you should then extend the pitchfork that will have the five lines. Depending on your trading strategy, you can also add the number of support and resistance lines.
How to use Andrews Pitchfork in trading
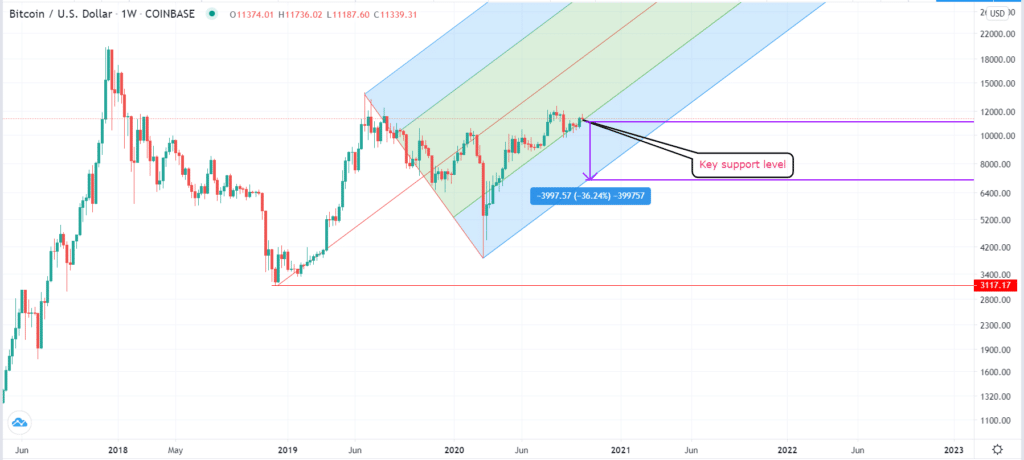
There are three main strategies of using the Andrews Pitchfork tool. First, you can use it to identify key support and resistance levels. The idea is that you should buy or short once the price crosses a key Pitchfork level.. A good example is in the Bitcoin chart shown below.
As you can see, we have started drawing the Pitchfork at the $3,117 support level. We have also placed the upper line at the $13,772 and the lower line at the $3,773 level. As such, the pitchfork shows that overall, the price will continue moving higher.
However, at the time of drawing, we see that the price is falling after it reached the $12,478 level. Most importantly, we see that the price is now struggling to move below the first support. Therefore, in this case, a good strategy to use is to short the asset once the price manages to move below the first support. After doing that, you should place the take profit at the second resistance at the second support level. Also, in this case, you should have your stop loss at the median line.
Example of how to use the Andrews Pitchfork
Using pitchfork to identify reversals
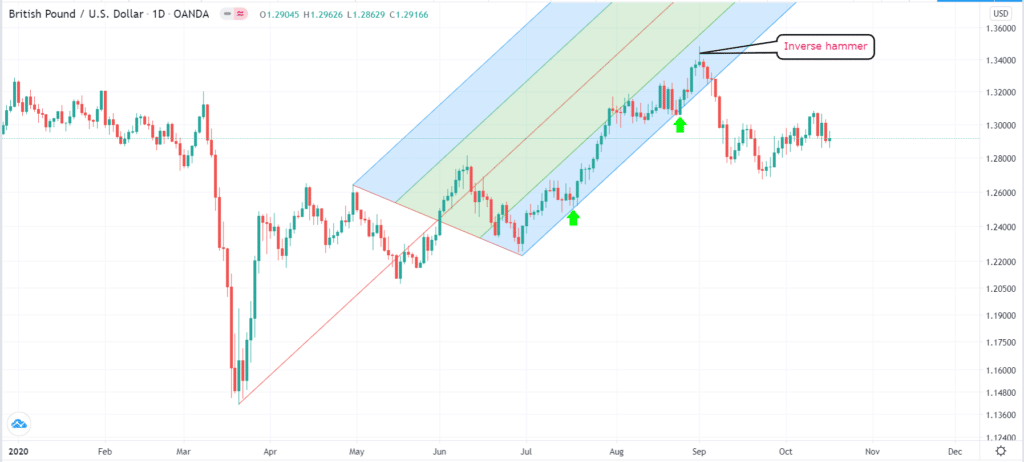
The second approach of using the Andrews Pitchfork is to identify reversals. Ideally, in most cases, when the price of an asset is rising, it is usually confined between two levels. As such, if it breaks out below the lower line, it is usually a sign that the asset’s price is about to reverse.
A good example of this is shown in the GBP/USD pair below. As you can see, as the price rose, it was between the first and second support levels. Indeed, the price struggled greatly to move above the first support. However, the price reversed when it formed an inverse hammer pattern and then moved below the lower line of the pitchfork.
Therefore, in this case, an ideal approach would be short the pair once it formed the inverse hammer and then hold the short position while paying attention at the lower line. If it moves below the pitchfork, it is a sign that bears have prevailed.
Pitchfork example 2
Using pitchfork to identify continuation patterns
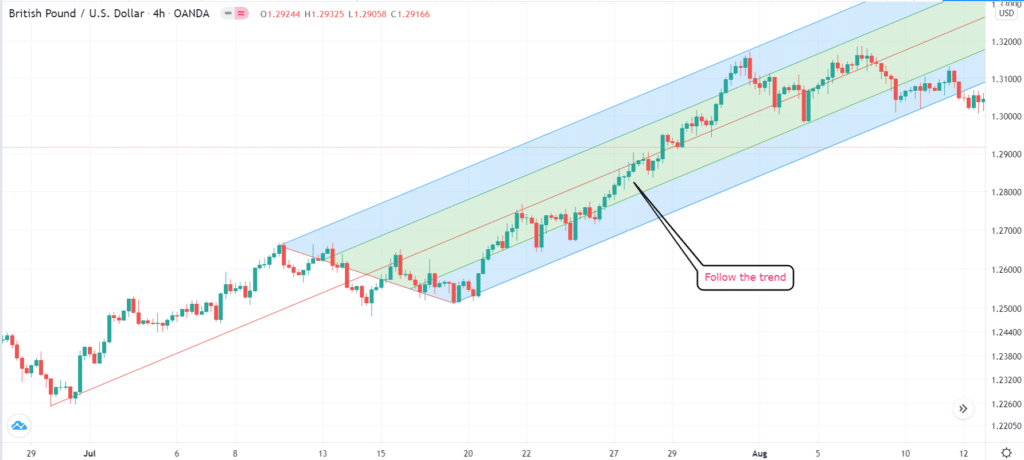
Third, you can use the Andrews Pitchfork to trade a continuation pattern. This approach is ideal when you are using the trend following trading strategy. This is a strategy where your goal is to buy an asset whose price is already rising. In this case, your strategy will be to buy the asset when the price is along the lower line of the Pitchfork and hold it until it tests the second resistance level. An example of this is in the chart below.
Pitchfork example 3
Combining pitchfork with other indicators
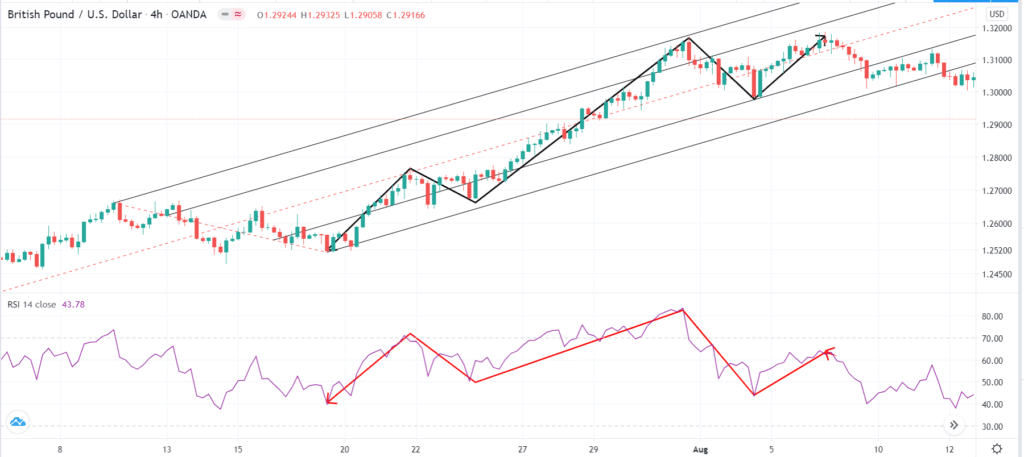
Finally, another popular trading strategy is combining the Pitchfork with other trading indicators. A good approach is to combine it with the Relative Strength Index (RSI), as shown in the chart below. In this chart, shorting opportunities emerged when the RSI moved to the overbought level and the price reached a key level of the pitchfork. Similarly, buying opportunities emerged when the price and the RSI were rising, and vice versa.
Andrews pitchfork example 4
Final thoughts
The Andrews pitchfork is one of the many tools you can use to trade in the financial market. It is ideal when you are following a trend, when you want to identify reversals, and when you want to complement other trading tools like the RSI and the Fibonacci retracement level. Also, it is worth noting that other variations of the Pitchfork have emerged. Notably, the inside pitchfork, Schiff pitchfork, and the modified Schiff pitchfork have become relatively popular also.


