The Dow theory is one of the oldest approaches of understanding the movements of financial assets like stocks, commodities, cryptocurrencies, and exchange-traded funds (ETFs), among others. The theory was developed by Charles Dow, the founder of Dow Jones and Company, which is now owned by News Corp. Having a good understanding of the theory will help you make informed decisions and avoid popular mistakes whether you are a trader or investor. In this report, we will look at the Dow theory and how you can use it in any market.
What is the Dow theory?
Charles Dow spent decades as a publisher of the Wall Street Journal. During this time, he observed the financial market and published many editorials about the performance. Upon his death in 1902, a group of financial journalists took it upon themselves to analyse and find patterns in his work. They then identified several key patterns, which they referred to as the Dow theory.
To be clear. Markets have changed in the past century. Today, millions of people are day trading in their computers and smartphones and the number of tradable assets has soared. We have stocks, indices, ETFs, currencies, commodities, mutual funds, options, futures, and cryptocurrencies, among others. Also, the concept of algorithmic trading and passive investing was not yet developed in this period.
While the Dow theory was not developed with these in mind, most of its principles work perfectly even in these assets.
Key parts of the Dow theory
In their writing, William Hamilton and Robert Rhea identified five key aspects that form part of the expansive Dow theory. These are:
Market discounts available information / role of news
In this, the Dow theory suggests that the market usually discounts all the available information when pricing an asset. This is why, stocks tend to be relatively volatile after a company releases its quarterly earnings.
Market movement
The Dow theory suggests that the market has three movements: primary, secondary, and minor. The primary movement is the overall trend of the asset while the secondary is relatively shorter. The minor period is the shortest.
In practical terms, as a day trader who uses a 15-minute chart, you should start your analysis by looking at the four-hour chart, hourly chart, 30-minute chart, and the 15-minute chart. Similarly, if you are a swing trader, you should start by looking at longer-dated charts and narrowing them to the shorter-dated ones. The goal of doing all this is to identify the overall trend and make informed decisions.
Trends have three phases
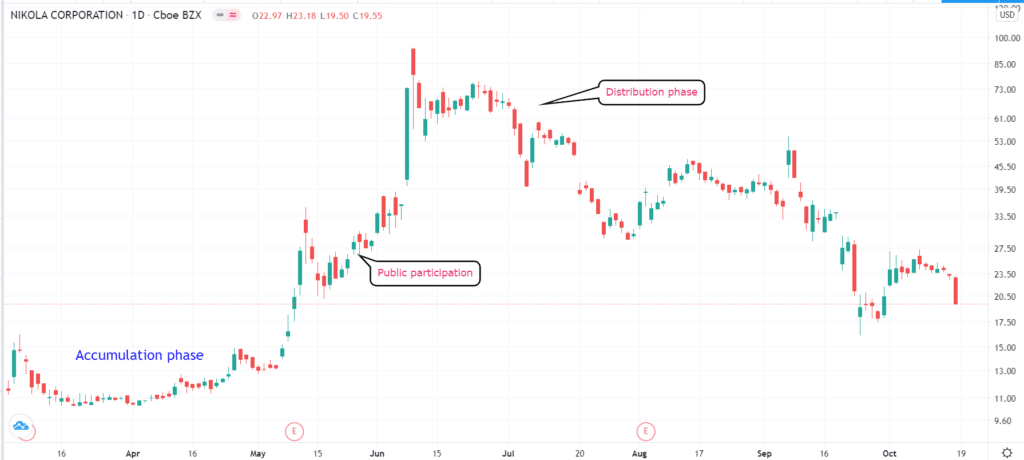
The Dow theory states that market trends have three key phases. The first is known as the accumulation phase, where people and investors are actively buying or shorting a stock or another asset. The second one is the public participation, where the fear of missing out sets-in and everyone starts buying or shorting the asset. The final phase is the distribution phase, where existing investors start exiting their trades.
We have seen this happen many times. A good example was in 2017, when everyone was talking about Bitcoin. As its price rose, most people, even those who didn’t know a thing about it started to invest, pushing the price close to $20,000. In the distribution phase, the price collapsed below $4,000. We also saw this pattern in Nikola, the hydrogen-truck company, as shown below.
Nikola accumulation and distribution

Volume confirms trends
According to the Dow theory, volume plays an important role in the financial market. Ideally, a rising trend that is not supported by volume will often fail. Similarly, a rising trend in a high-volume environment will tend to stay for longer. That is because a higher volume tends to confirm that the thesis is correct.
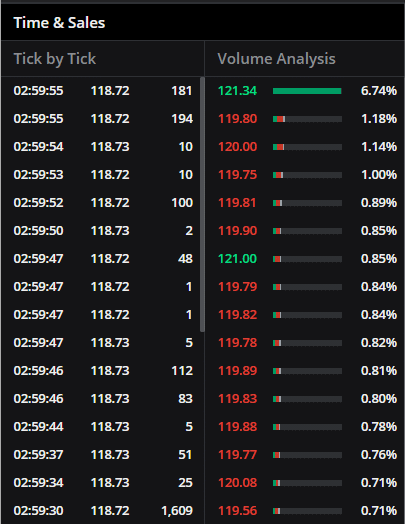
At the same time, you can predict when a reversal is about to happen when volume starts to wane. Fortunately, most trading platforms like TradingView and MetaTrader have a volume tab. For stocks, you can check out this volume using level 2 and time and sales tool. The screenshot below shows how a time and sales table for Apple stock looks like.
Volume analysis using time & sales

Trends continue until opposite force emerges
Finally, according to the Dow theory, an asset in an upward or downward trend will continue moving in the trend’s direction until it meets an equal opposite force. This is similar to the physics’ principles by Sir Isaac Newton. In the currencies market, the opposite force could be a sudden change in the Federal Reserve’s tone. Similarly, in stocks, it could be sudden news or weak earnings.
How to trade using the Dow theory
Unlike other trading approaches, the Dow theory does not tell you when to buy or sell an asset. However, you can use its principles to know whether a certain trade makes sense or not. It can also help you avoid being caught-up in the fear of missing out (FOMO) situations. Let us look at a simple approach you can use the theory to make profitable trades.
First, using the first principle about market discounting everything, you need to have the knowledge of all recent news and events that are moving an asset. If you are a stocks trader, a good place to start is in the premarket or afterhours trading. Ideally, you want to see the top movers before the market opens and then get all the information about these movements.
At the same time, you should check the volume that is moving the stock price and whether it is above or below average. The chart below shows the top movers and volume in afterhours trading as of this writing. In this period, you should also consider using level 2 and time and sales data to see volume of transactions.
Afterhours top movers

Next, you should identify the phase that the price is in. You should do this by narrowing the trading chart, based on your trading strategy. If you are a day trader, start from the four-hour, down to the relatively smaller charts like 15 minutes. This analysis will help you understand the overall trend and guide you in placing your trades.
Also, you should consider the other principles of the Dow theory, like following the trend and by understanding the phase the trend is.
Final thoughts
The Dow theory is an important method you can use to understand the overall performance of the financial market. Although it was developed with stocks and the Dow Jones index in mind, it can easily be applied in all markets, including the currencies and digital currencies market. As a trader, we recommend that you spend time learning about the theory and how you can use it in your daily trading.


