Of the various analytic instruments that traders use, the most significant are the charts. Irrespective of the trading avenue you prefer, understanding them and grasping the skill of reading them are two important things you cannot ignore. In this guide, you can learn about the essentials, the chief types used by traders, and how to read them.
What is a forex chart?
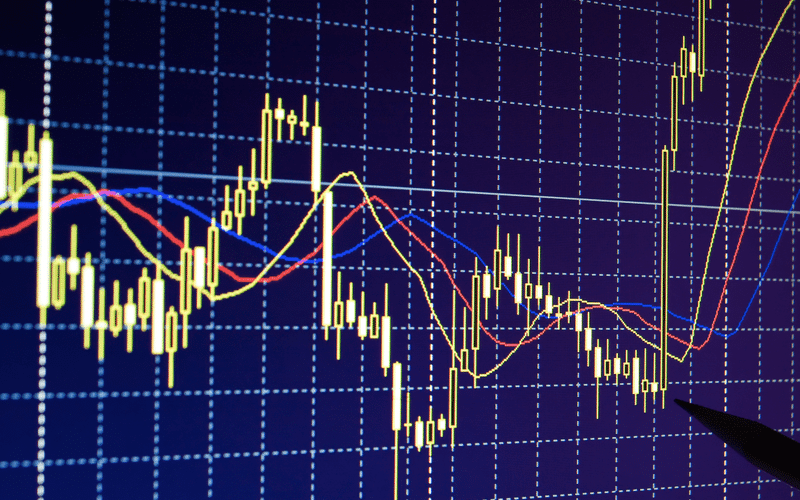
The graphical depiction of the exchange value of a currency pair is called the forex chart. For instance, in the chart below, you can know about the exchange rate. The varying forms also display the differences in currencies, namely Euro and USD.
Similarly, you can find charts designed for diverse currency pairs. The charts depict specific timeframes that range from one minute to one month and even longer span.
Types of Forex Charts
There are diverse kinds of forex charts. They are formed to assist you in understanding trading data easily. Some of the most favored ones are explained here.
Line Charts
Being a basic format, this category is very simple and easy to grasp. Although it delivers rudimentary information, it is possible to spot numerous disparities. It is fixated on the applicable value over a specific span. The chart involves a line that links all the pertinent prices, giving you important data for analysis. An example is shown below.
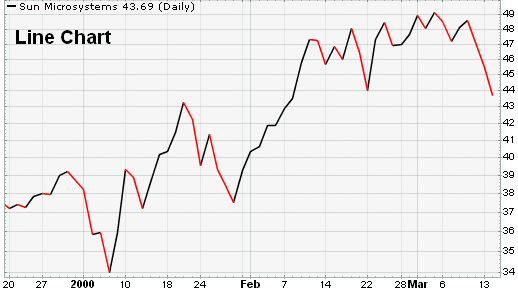
Traders mostly focus on the closing level and disregard other pointers. They ignore price oscillations inside a session. You can use this form chiefly to grasp the general price trends but cannot read the gaps.
Tick charts
Among those depicting day trading for measuring transactions, this is a straightforward and effective method to assess the forte and momentum of price changes. You can measure the contract amount per bar. In the image here, you can find 610 transactions per bar.
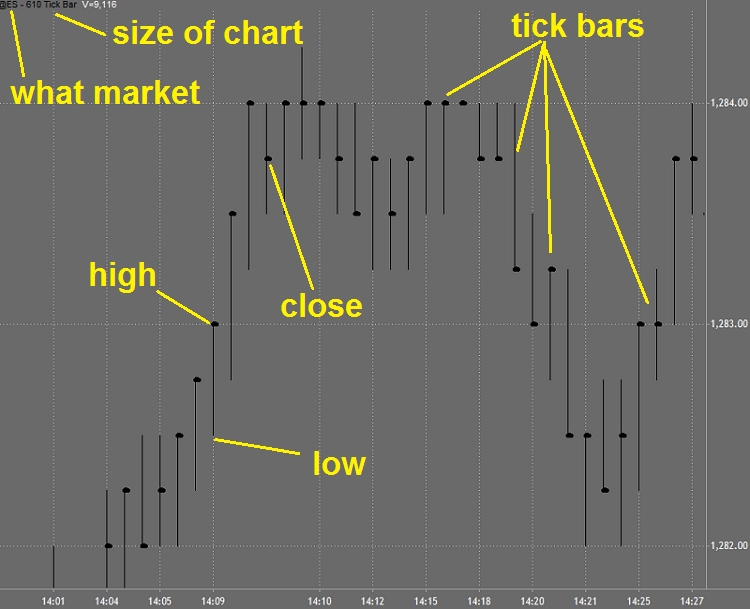
The closing value is of significance here as the past price level does not have any influence on the future movement.
Bar charts
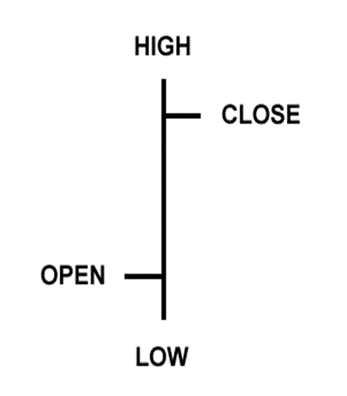
It is possible to know about the movement of price in a certain span using this chart. It is also termed as OHLC (Open, High, Low, Close) chart. The picture below shows a typical bar.
Its size can individually change or do so over a set. The bottom part shows the lowest price dealt over a specific span and the top part shows the uppermost value for the currency. The complete bar specifies the transaction range of a currency pair. And, it also represents a specific span, such as a day, hour, or week.
It can increase in length as variations turn volatile and smaller when there are fewer oscillations. The horizontal line to the left indicates the opening value. The closing value is shown by the line on the right. Here, the key point to remember is that you can spot the volatility. However, it is tough to evaluate the growth or fall in prices.
Candlestick charts
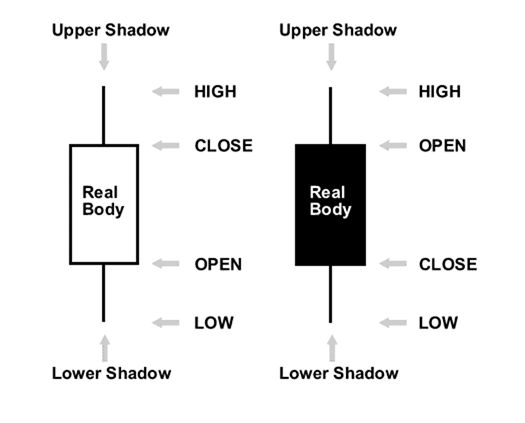
This is an advanced graphic depiction of the bar chart. This type is crafted to make reading movements simple. It consists of a vertical line for the low and high range. The part in the center called body, relates to the open and close values.
Further, these are featured with different colored bodies for denoting the bearish or bullish nature. In general, a colored body indicates a currency has closed at lower value than its opening rate. These are basically of two types, namely bullish and bearish.
- The image below shows an unfilled or hollow body, where the rate is higher at closing level and low at the opening. This is termed as the bullish candle.
- For the black or filled body, the price is low at closing when compared to the opening value. This is termed as the bearish candle.
These are advantageous as they are easily understood. You get to spot the key changes happening.
.
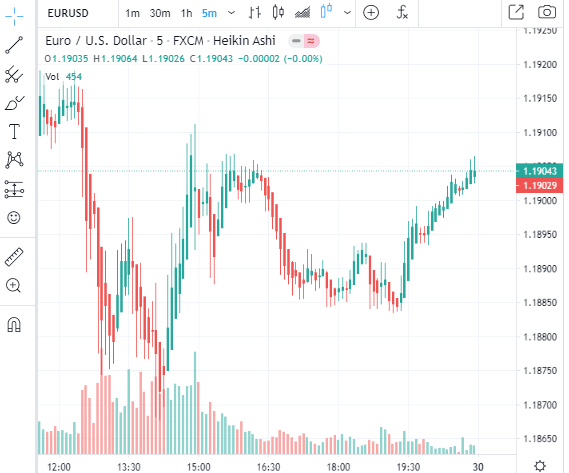
Heikin-Ashi
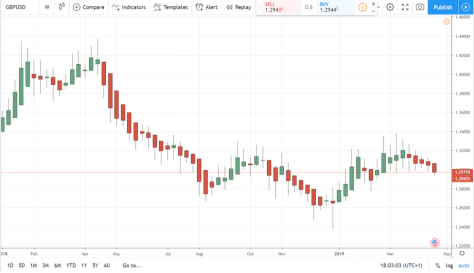
This bar pattern means average bar in Japanese. Dubbed as better candlestick version, this chart is favored by expert traders for its simplicity. It applies a special method that uses a minimum of four principles to evaluate the different positions of the preceding and existing pattern.
The image depicted here shows the uniform pattern where you can spot trends without any hassle. The GBP/USD trade pattern shows double top feature at the start with a robust bearish change towards the latter part.
Renko
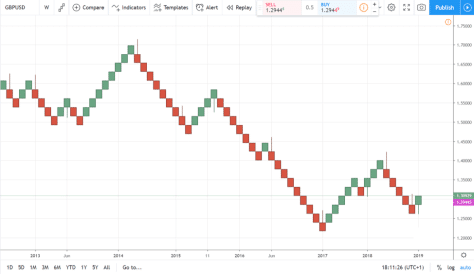
Another Japanese named chart, meaning brick, this is a measurement of the price movement of a currency pair. Here, a fresh brick is added if the value inches forward in a precise predetermined distance. The Average True Range (ATR) and a 14-span are used to choose the size of the distance.
If a particular action exceeds this distance, another brick is included. Below is a sample for GBP/USD pair. The important thing here is that it can analyze a greater period. It shows price-related changes over a 5-year span.
Reading a Forex Chart
From the above information, it is clear that reading a forex chart, especially the five types revealed here, is not as complicated as it may seem at a glance. While line chart is focused on closing values over a specific span, bars give a reading on a greater number of positions.
Candlesticks help in improved prediction of price changes. You get an instant glimpse of the sentiment prevailing among traders. Reading a chart is crucial for every trader. This is because it guides you in the right direction, while you undertake a technical analysis.
Conclusion
Forex charts are undoubtedly superior tools for assessing the financial markets. They assist in arriving at the right choice in trading. However, it is prudent to keep in mind that they are more about minimizing your risks. They should not be used to predict the future profits.
You can land in deep trouble, if you try to guess movements based on past patterns that look similar to the present patterns. The historical patterns were a result of a combination of factors, such as different information points, different analysts etc., which cannot be replicated for the present patterns.


