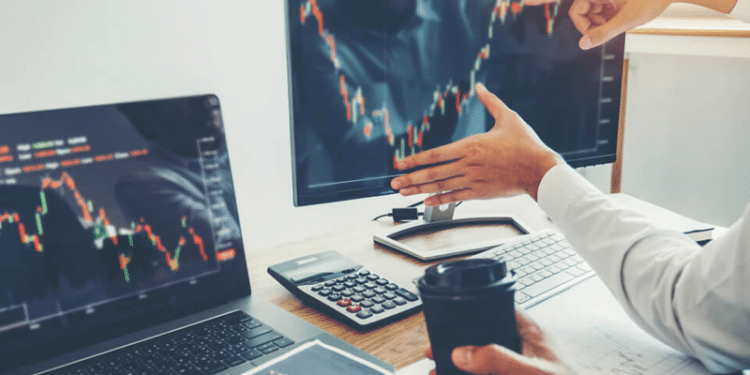
Many traders tend to dismiss volume as not being reliable enough in the forex market. While the volume traders see on their chart is not the actual volume, its actually the tick volume from the broker’s platform. In the forex market, both price and volume are like basic raw materials of the chart. Volume is a technical tool which traders can use to analyze the movement of prices. The combined study of price and volume gives the trader a clear picture of the psychology of the market.
Importance of Volume
While analysing forex markets, not many traders use volume. The reason behind is that most forex trades take place in the over the counter (OTC) or the interbank market where volume data is not always readily available. However, you can find forex volume data by using futures markets or other sources. When you trade in the interbank market, you may notice that futures volumes are a great proxy for overall volume. This is because the relative volume is the most important; actual volume does not matter much.
There are some questions you need to ask when you look at volume. You need to know if volumes are high on the day you are trading. Moreover, it is also important to know if the volume in the latest hour is higher than usual. Lastly, observe the volume in the past 10 minutes and compare it with volume in other 10minute periods. Can you see a big price move on extreme volume?
To understand this better, we would suggest you study the theory about how price and volume interact in financial markets. After that, you can come up with your own strategies on combining price and volume in forex. It is a great source of edge for any trader because most forex practitioners barely factor in volume.
In our opinion, a potential volume plus price setup is when there is a large volume spike at a price extreme. This situation indicates capitulation as the market transacts high volumes within a short span. It transfers many positions very fast and usually moves the risk from weak hands to strong ones.
Understanding A Chart
The chart below is a brilliant example of this. The market was hit by some bad news with a weak US retail sales report and Ebola on October 15, 2014. At that time, the market wore a huge structural short position in fixed income. It means that the market was short bonds and there were positions for higher rates. There was a huge unwind in the fixed income markets. There seems to be a correlation between US interest rates and USDJPY. So, when US yields started to collapse, USDJPY also started falling.
When the fall gained momentum, volume began to pick up. The climax of the move was a complete crap out on massive volume. In the chart, you can notice that the low in the price displayed by black bars coincides with the volume spike that is showed by bars below. When volume fell off, USDJPY gained its footing again and rallied back slowly.
You need to trade these volume spikes in a way to stay out of the way until the dust is settled. In the chart, you can see 30minute USDJPY bars in black and volume as bars below. When you see a massive volume spike like the one in the chart, you have to wait until you see two or three bars for 60 to 90 minutes of falling volume. Roughly after 90 minutes, you may see that things are starting to settle down. Then you can choose to go long with a stop below the lows.
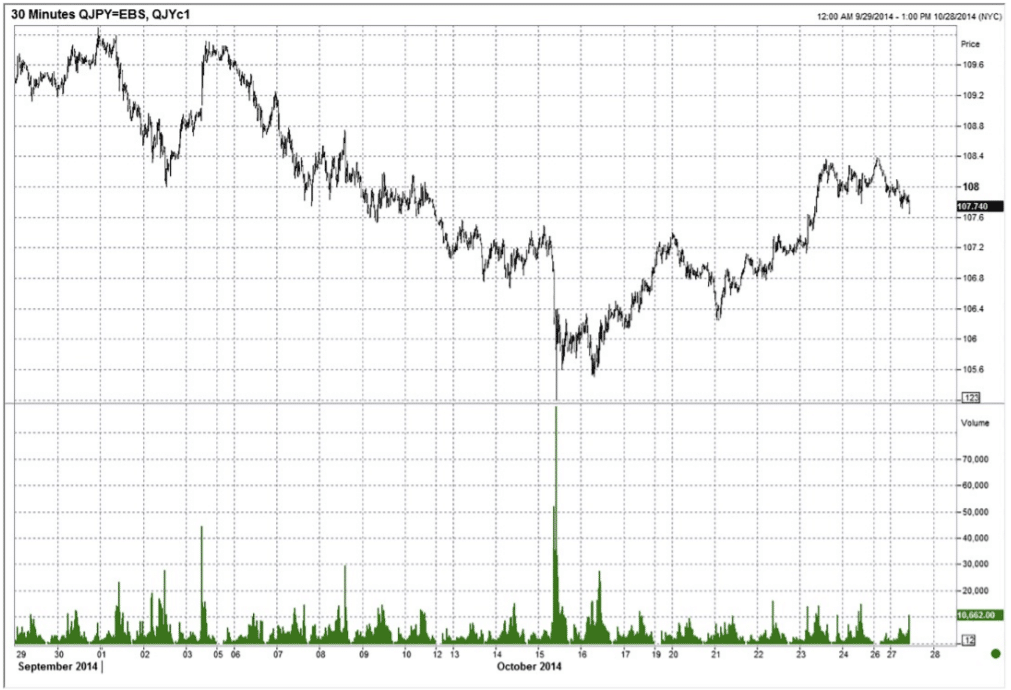
The image above is the 30minute candle chart with volume bars below displayed in grey, from September 29, 2014, to October 28, 2014.
In this case, with a stop at 105.14, you go long at 105.70. You have to look for a rally back toward the top of the waterfall move which is at 107.40. As mentioned earlier, you should never purchase USDJPY just because there was a volume or price spike. A trader must always wait to have other reasons for the trade apart from a lone technical signal. However, you cannot deny that the spike in volume or price is one of the most crucial and powerful signals available that can lead you to some great trades. It combines both the major variables to form a hybrid trading indicator of sorts.
Conclusion
The large price move on the volume spike above is a perfect example of using quantitative analysis for the identification of the peak moments of fear or greed.


