ForexEzy
No Result
View All Result
  • Home
  • Forex Education
    • Forex Basics
    • Forex Trading Strategies
    • Money Management
    • Risk Management
    • Technical Analysis
    • Fundamental Analysis
    • Trading Psychology
    • Social Trading
    • Automated Trading
  • Forex Tools
    • Forex Robots
    • Forex Indicators
    • Forex Signals
  • Top Forex Brokers
  • Top Forex Robots
  • Commentary
  • Blog
No Result
View All Result
ForexEzy
No Result
View All Result
Home Forex Education Forex Basics

Top Trading Setups: Triangle Breaks

by Richard Brase
August 4, 2020
in Forex Basics
0
Top Trading Setups: Triangle Breaks
1
SHARES
11
VIEWS
Share on FacebookShare on Twitter

Triangle Chart Patterns

In Forex trading, triangle chart patterns refer to a continuation pattern which involves the price moving to a tighter range as time goes by. It provides a visual display of a battle between bears and bulls. A triangle pattern usually forms when it includes fives touches of resistance and support. For instance, two touches of the support line and three for the resistance line. There are generally three types of triangle chart formations, namely, symmetrical ascending and descending. 

In a Symmetrical triangle, the slope of the price highs and that of the price lows converge together to form a triangle. The market makes higher lows and lower highs. A clear trend cannot form because the buyers and sellers aren’t pushing the price far enough. As a result, it forms lower highs and higher lows. The breakout gets near as these slopes get closer to each other. The Trader doesn’t know the direction of the breakout but is assured that a breakout will occur. 

In an Ascending triangle, there is a clear resistance level and a slope of higher lows. In this situation, buyers cannot exceed a certain level but are gradually starting to increase the price by the higher lows. The buyers keep on putting pressure on the resistance level till a breakout is bound to occur. 

In a Descending triangle, a string of lower highs forms the upper line with the lower line forming a support level in which price does not seem to break. The price makes lower highs which indicates that the sellers are starting to gain ground against the buyers. The price eventually breaks the support line and continues to fall. 

Triangles are similar to pennants but possess no flag pole. In other words, the price action is more gradual in this case. They can lead to extremely profitable and clean breakouts. When a trader believes that there is a strong trend, they can look for triangles and jump on them. 
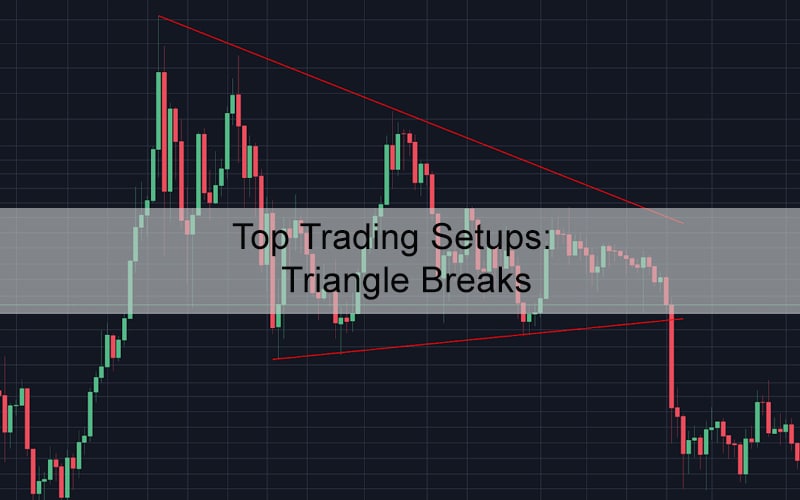
Triangle Breaks

Among the forex trading community, triangles attract attention because they are logical to trade and easy to spot. Price consolidations that have higher lows and lower highs form triangles on charts. When these triangles break, they can indicate either a continuation of a reversal or the trend. 

Triangle Breaks

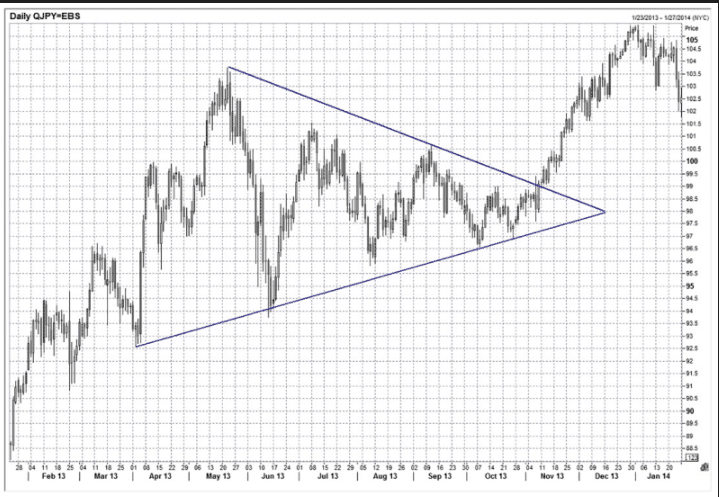
The above is a standard triangle formation and breakout for the daily USD/JPY chart from January 2013 to January 2014. From April 2013 to October 2013, one can see that the USD/JPY consolidated. It made higher lows and lower highs until finally breaking through the top of the triangle. It ultimately made a run for the 100.00 marks, hence forming a classic example of a triangle consolidation and breakout. 

There is a second derivative of the broken triangle setup that is equally powerful. This scenario usually occurs when the triangle breaks in one direction and then fails to do so. It turns back through the triangle in the opposite way. Traders who are waiting patiently for the triangle to break, enter at this moment. They need to stop out when the pattern fails. This concept is similar to the Slingshot Reversal. In both cases, there is a clear pattern, a break out that fails, and finally rapid momentum in the opposite direction. 

Triangle Breaks

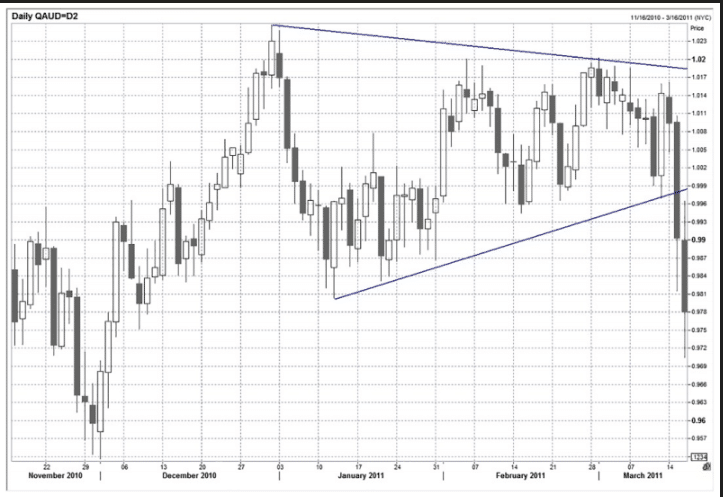
The above is the daily AUD/USD chart for November 2010 to March 2011 and is a nice triangle breakout to the downside. However, the chart below shows us what happened next. 

Triangle Breaks

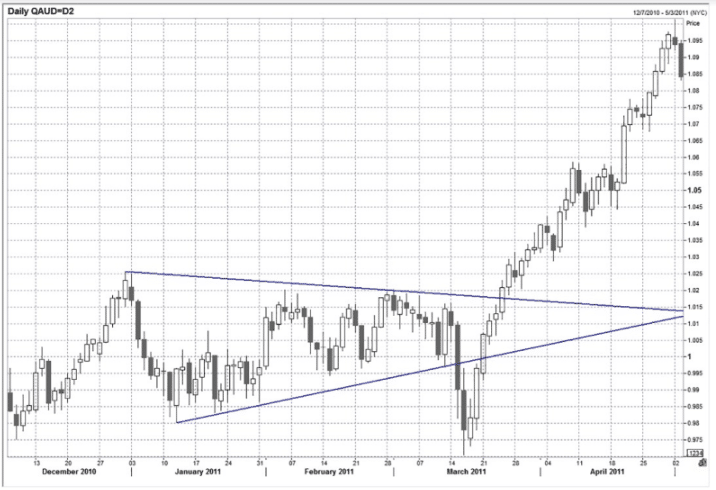
The above is the daily AUD/USD chart for December 2010 to May 2010, with a failed triangle reversal. This is a classic triangle break followed by a reversal that is very impulsive. Traders who are bullish on the AUD/USD can see this triangle setting up. They will play the breakout to the topside, based on the standard triangle breakout concept. 

However, in this chart’s case, the bottom of the triangle breaks without the top breaking. If Traders are bullish, there will be no trade at first. The AUD/USD then closes above the bottom of the triangle or in other words, rallies back up inside the triangle. Traders should go long, placing their stop loss outside the bottom of the triangle. This is an extremely rare setup but is powerful as well. Traders should be on the lookout on hourly or daily charts for broken triangles. Once the AUD/USD re-enters the triangle, it rallies much higher. 

Conclusion

They are some key things traders have to remember when trading with triangle patterns in the forex market. Traders have to always be cognizant of the trend’s direction before the consolidation period. They can identify triangle patterns forming by making use of the upper and lower trendlines. To mitigate the risk of a false breakout, traders should adhere to sound risk management practices. This will ensure that they maintain a positive risk to reward ratio on all trades.

Share1Tweet
Previous Post

Top Trading Setups: Extreme Volume Spikes

Next Post

EUR USD: How to analyze the most liquid forex pair

Related Posts

Easy Day Trading Strategies for Beginners

Easy Day Trading Strategies for Beginners

by Tim Baudin
April 7, 2021
0

Day trading is the art of executing your trades and closing them within 24 hours. The people who perform this...

Pros and Cons of Market Execution and Pending Orders in Forex

Pros and Cons of Market Execution and Pending Orders in Forex

by Chintan Patel
March 31, 2021
0

Not all orders in forex are made equal; traders have the option of placing an order that will immediately fill...

5 Lessons We Can Learn From ‘The Market Wizards’ book series: Part 2

5 Lessons We Can Learn From ‘The Market Wizards’ book series: Part 2

by Tim Baudin
March 5, 2021
0

This article is a continuation of the five lessons we can learn from ‘The Market Wizards’ book series, one of...

5 Lessons We Can Learn From ‘The Market Wizards’ Series: Part 1

5 Lessons We Can Learn From ‘The Market Wizards’ Series: Part 1

by Chintan Patel
February 19, 2021
0

Have you ever heard about the ‘Market Wizards’ series by Jack Schwager? These trading books are among the best-selling in...

Forex Trader Toolkit for Pros

Forex Trader Toolkit for Pros

by Chintan Patel
December 31, 2020
0

Using proper tools can significantly increase your profitability. The great thing about trading Forex and CFDs is that the majority...

Load More

Leave a Reply Cancel reply

Your email address will not be published. Required fields are marked *

Best Forex EA

  • ROFX 9/10
  • Forex Fury 8/10
  • FXgoodway 7.5/10
  • Z Trader FX EA 7/10
  • Forex Incontrol Reborn 6.5/10

Popular News

  • The Best RSI and CCI Combination Trading Strategy for Optimum Returns

    The Best RSI and CCI Combination Trading Strategy for Optimum Returns

    2 shares
    Share 2 Tweet 0
  • Rofx Review – High Profitability and Stable Performance Analysis

    29 shares
    Share 29 Tweet 0
  • The Best Forex Scalping Strategy – Using 3 Popular Technical Indicators

    0 shares
    Share 0 Tweet 0
  • The Best MT4 Indicators & Expert Advisors For Forex Trading

    2 shares
    Share 2 Tweet 0
  • How to check if the indicator is repainting?

    2 shares
    Share 2 Tweet 0

Trading

Footer

We are dedicated to demystify the world of forex trading for you – no matter what level you are on.

Categories
  • Automated Trading
  • Day Trading
  • Forex Basics
  • Forex Brokers
  • Forex Education
  • Forex Forecasts
  • Forex Indicators
  • Forex Market Commentary
  • Forex Robots
  • Forex Signals
  • Forex Tools
  • Forex Trading Strategies
  • Fundamental Analysis
  • Money Management
  • News
  • Risk Management
  • Social Trading
  • Technical Analysis
  • Top World Traders
  • Trading Psychology
  • Uncategorized
Tags
arbitrage atr bollinger bands cci chart patterns classics copy trading courses day trading forex brokers forex charts forex ea forex education forex forecasting Forex Indicators forex software reviews grid trading hedging ichimoku macd market cycles news trading oscillators price action trading rsi social trading strategies tips & tricks trading bots trading platforms trend trading Video
  • Terms of Use
  • Privacy Policy
  • Compensation Disclosure
  • Risk Disclosure
  • About Us
  • Contact Us

Copyright © 2021 by ForexEzy.com

No Result
View All Result
  • Home
  • Forex Education
    • Forex Basics
    • Forex Trading Strategies
    • Money Management
    • Risk Management
    • Technical Analysis
    • Fundamental Analysis
    • Trading Psychology
    • Social Trading
    • Automated Trading
  • Forex Tools
    • Forex Robots
    • Forex Indicators
    • Forex Signals
  • Top Forex Brokers
  • Top Forex Robots
  • Commentary
  • Blog

© 2021, Forexezy.