Trading in any market is not an easy task, especially for complete beginners. So, any chance at finding techniques that make it easier to tread the market is a boon for traders and potential investors. The Heikin-Ashi Candlesticks is one such reliable technique that can make your investing experience smooth and safer. Given below is your guide to understanding the Heikin-Ashi candlesticks and how to use them effectively for your daily trading needs.
What are Heikin-Ashi Candlesticks?
In the literal sense, Heikin-Ashi means the “Average Bar” in Japanese, precisely what these candlesticks are. The Heikin-Ashi candlesticks use average values of highs, lows, opens, and closes to derive the desired charts and remove many extreme units in the process. This filtering makes it a lot easier to read them while reducing market noise and large deviations. You can use this tool along with regular candlesticks to spot market trends and forecast futuristic values for various securities efficiently and make more confident decisions about your investments.
Widely used across the commodities market, the Heikin-Ashi candlesticks can be considered a modified version of the regular candles. They share some characteristics with traditional candles but use an adjusted formula of close-open-high-low that the price makes within the given time period. The candlesticks not only depict the movement of the chosen period but also include historical price information.
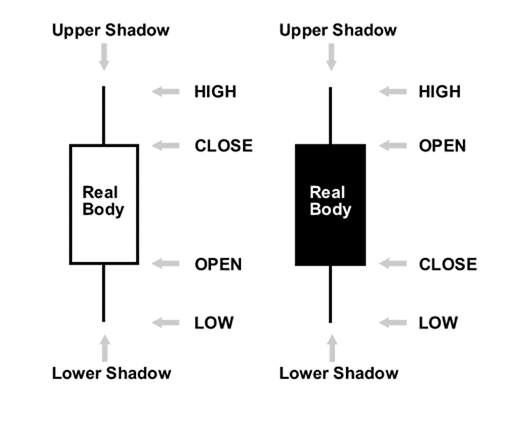
The four parts of the Heikin-Ashi candlestick and their formula are detailed below:
- High: It denotes the actual high of the given time period – the maximum price reached. It could be the highest shadow, open or close – whichever is the highest in the period.
![High=Max [High, Open, Close]](https://forexezy.com/forexnow/wp-content/uploads/2020/08/Heikin-Ashi-and-Regular-Candlesticks1.png)
- Low: It marks the actual low value an asset has reached in a given time period.
![Low=Min [Low, Open, Close]](https://forexezy.com/forexnow/wp-content/uploads/2020/08/Heikin-Ashi-and-Regular-Candlesticks2.png)
- Open: It is the price that an asset opens with on a given day (equals the previous candle’s midpoint.)

- Close: The price of the asset at the close of the time period. It is the average value of the four parameters.

Heikin-Ashi vs. Regular Candlesticks: What is the Difference?
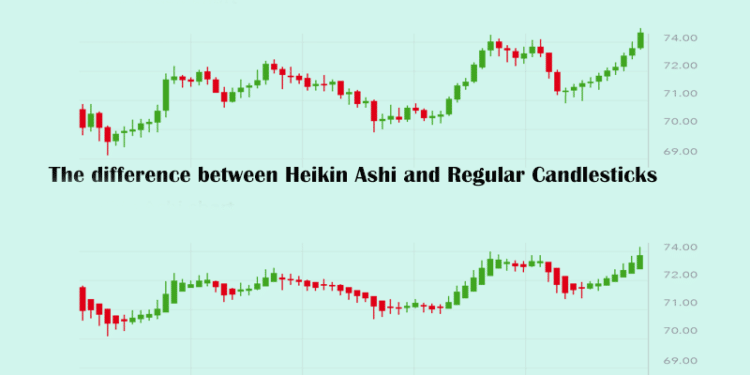
Although they appear similar at first sight, there are quite a few differences between Heikin Ashi and regular candlesticks. The Heikin-Ashi candlesticks can be built like regular candlesticks. However, the formula for each bar is different. Since regular candlesticks use actual values, their trends tend to fluctuate more often and are relatively irregular. On the other hand, average measures of Heikin Ashi crop out extreme values leading to smoother candlesticks and more stable trends. The Heiken-Ashi candlesticks also tend to alternate between red and green during a downtrend and an uptrend, respectively, while regular candlesticks take turns with the colors even if the price moves vigorously in one direction.- Therefore, Heikin-Ashi is considered to be easier to read compared to the former.
Where regular candlesticks make use of securities’ actual prices to drive trends in a time series, Heikin Ashi candlesticks use two-period averages. However, the disadvantage of this is that it sometimes also removes vital information about the price action. Furthermore, Heikin Ashi trends also exhibit irregular gaps in the patterns, whereas the regular candlesticks remain fairly stable in terms of gaps. Traditional candles have been known to show sudden uptrends or downtrends consecutively. Heikin Ashi candles are known to have similar trends consecutively, making it easier to spot price patterns.
Heikin Ashi Trading Tips: How to Use Them?
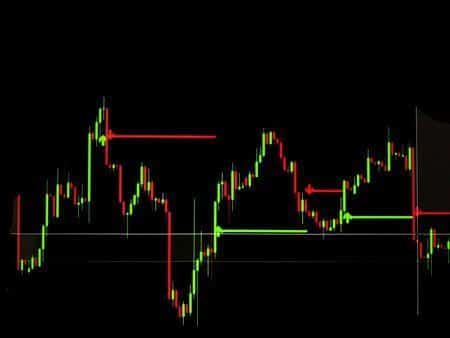
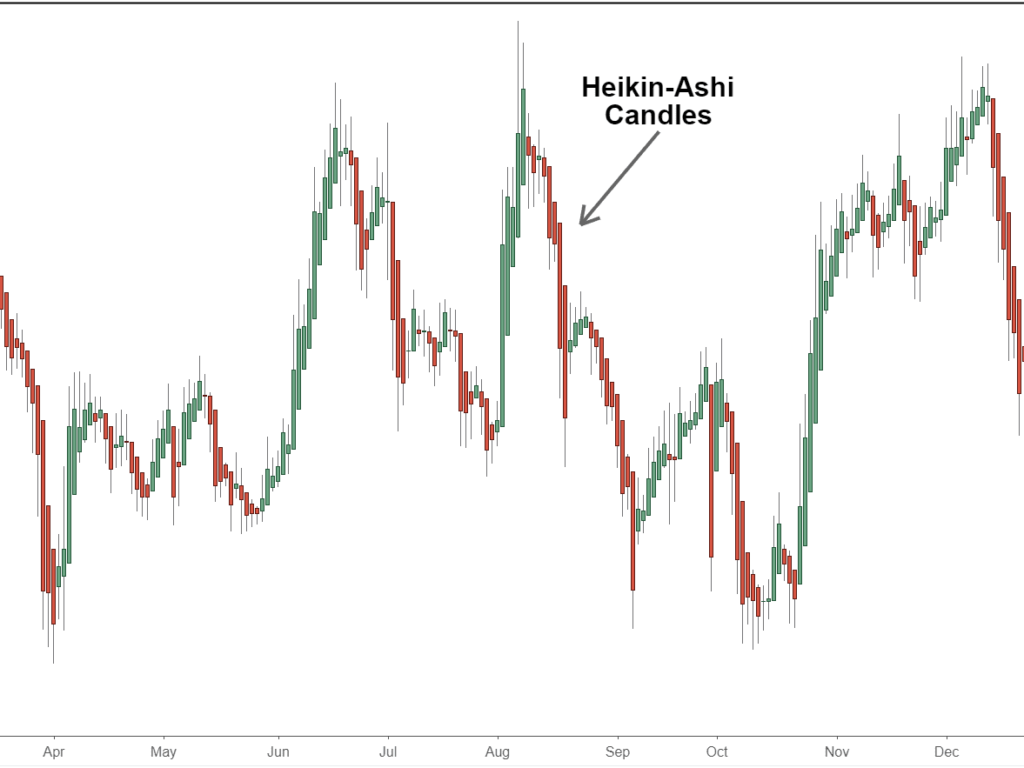
Heikin-Ashi charts are applicable across markets, and thus most platforms have this tool included as an option. Ordinarily, the Heikin-Ashi charts tend to be fairly regular with their trends – their uptrends or downtrends do not fluctuate as much as regular candles. You can see from the charts above how the Heikin-Ashi candles depict continuous uptrends/downtrends, whereas the regular candles don’t.
Typically, Heikin-Ashi gives you five primary signals to weed out the perfect buy and sell opportunities from the sea of trends.
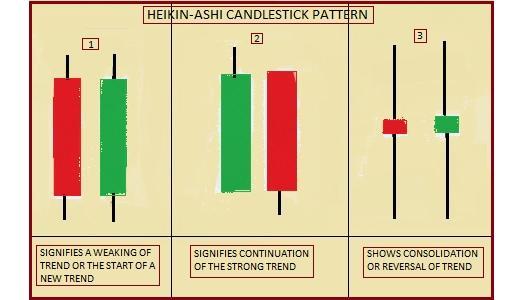
Red or filled candles without shadows is a marker of a steadily falling market – it is better to stay short and wait for the downtrend to change before entering. Similarly, filled or red candles designate a downtrend and signal to enter with short positions and exit the long positions at this time. In contrast, green or hollow candles without upper wick or shadows represent a robust uptrend, so ride the trend and optimize your profits. When you notice a simple green or hollow candles, add long positions and exit the short positions.
Candles with smaller bodies and relatively long upper and lower wicks suggest a change in trend. This phase of change may be considered quite risky – amateurs should better stay away during this time and wait for a steady trend to arise to enter the game. However, investors with a greater appetite for risk can use the trend to buy or sell.
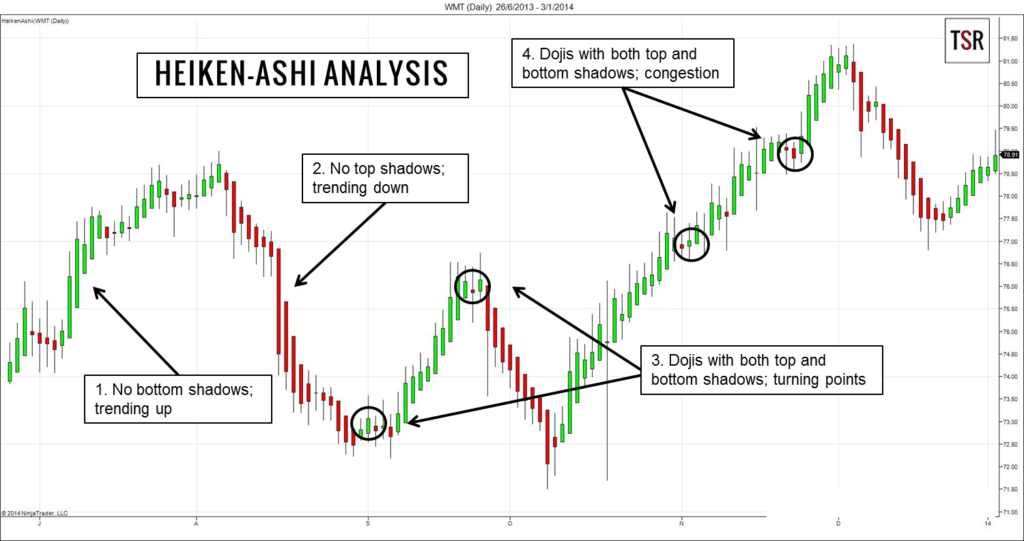
As you can see from the chart above, these trends are relatively easy to spot and are not broken up by ‘false signals.’ When reading trends through these candlesticks, it is imperative to look at the bigger picture. A change in color may not necessarily mark the conclusion of a trend but also reflect a pause. However, it is usually smart to stay in a profitable trade until the candles change color.
Conclusion
Heikin-Ashi candlesticks are easy-to-understand and effective tools. They present a clear picture of the market for traders and investors. They are sufficient to understand the present market conditions and also help in trend forecasting. The Heikin Ashi candlesticks can be used in conjunction with regular candlesticks for their efficiency in representing trends with ease. They reduce market noise while screening out extreme values from the measure to form smoother and more readable trends. However, the downfall of this is that it results in the loss of some relevant data and leads to huge irregular gaps in the trends. Nevertheless, the advantages of these candles far outweigh the cons, which is why they continue to remain one of the most-used trader’s tools even now.


