You can use several methods to find and trade trends in the GBP/USD currency pair, but one system uses consistently good results. Generally, it is recommended to not use systems that only work with one pair. However, the results of this method are too good to ignore. Moreover, the GBP/USD pair has its own personality, and it usually has larger than normal moves within a session, and within the overall trend.
What is a Price Channel Indicator?
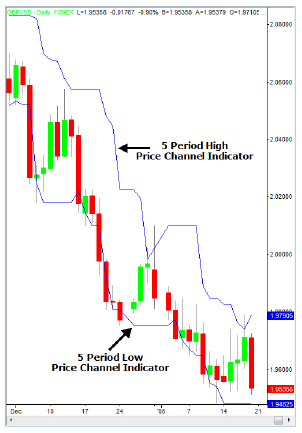
The famous Turtle traders used to determine breakouts of the last fifty-five and twenty days by using the price channel indicator. We can use the same theory in a shorter timeframe. The high and low of the previous five sessions can be used. The price channel can decide on the setup and entry. Look at the example below to see a five-period price channel indicator.
The Setup
Long Price Channel Setup
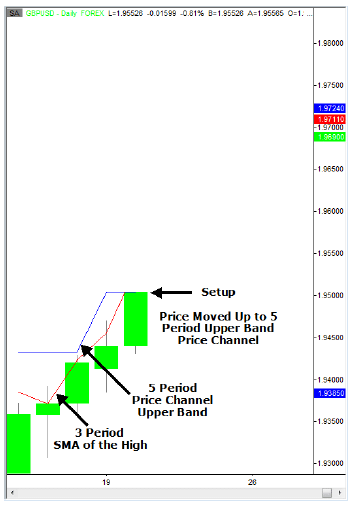
The setup for a long price channel trade takes place when the price goes up to the highest high for the last five sessions. Ignoring the most current session is the easiest way of calculating the highest high of the last five sessions. Then, you may draw a horizontal trend line from the highest high that starts with the fifth session and moves forward to the present session.
Short Price Channel Setup
The setup for a short price channel takes place when the price goes down to the lowest low of the last five sessions. To calculate the lowest low of these five sessions, you can draw a horizontal trend line from the lowest low that starts with the fifth session and moves forward to the present session.
Trading the Price Channel Indicator
The Entry
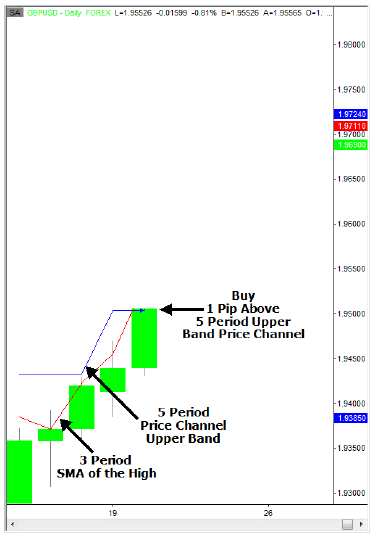
Long Price Channel Entry – The entry takes place when the price goes one pip higher than the highest high of the last five sessions.
Short Price Channel Entry – The entry takes place when the price goes one pip lower than the lowest low of the last five sessions.
The Stop Loss
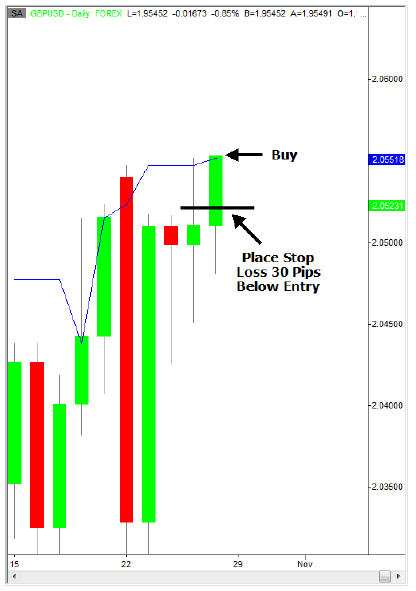
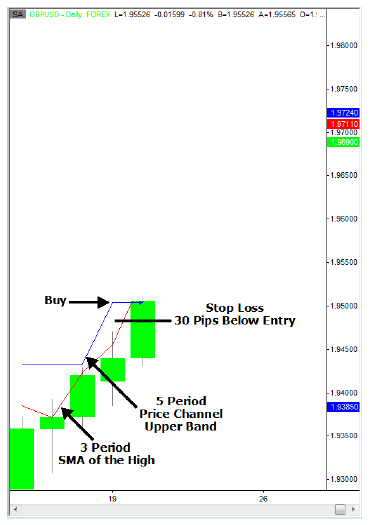
Look below to see an example of a long price channel stop loss that is placed 30 pips below the entry –
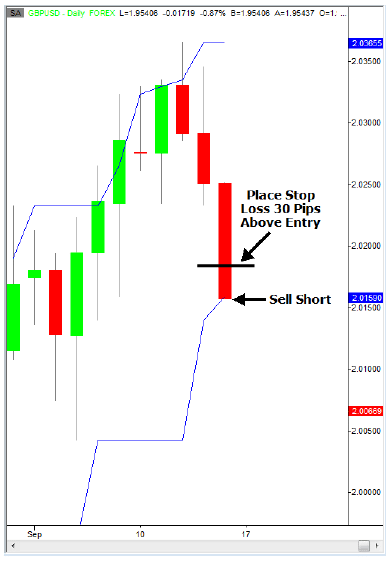
Below, you can see an example of a short price channel stop loss placed 30 pips above the entry –
The Exit
The exit we can use is a three-period high/low channel cross. You can visualize this the best way by plotting two simple moving averages (SMA). You may plot the SMA of the high of the previous three periods for a long trade. On the contrary, for a short trade, you can plot the SMA of the low of the previous three periods.
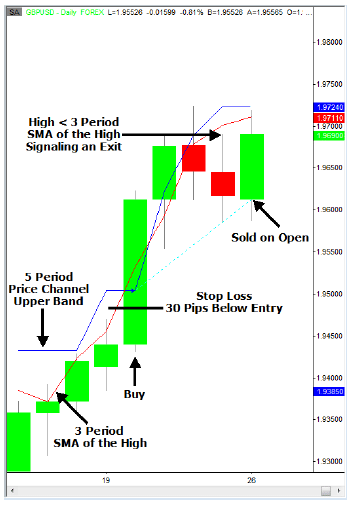
Long Exit – The long price channel exit for the five-session price channel takes place when the high is lower than the SMA of the high of the previous three sessions.
Short Exit – The short price channel exit for the five-session price channel takes place when the low is higher than the SMA of the low of the previous three sessions.
Rules for GBP/USD Trend System Trading
Long Trades
Long Setup – You can look for price to go up to the upper band of the five-period price channel indicator.
Long Entry – You may buy one pip above the upper band of the five-period price channel.
Long Stop Loss – A hard stop can be placed below the entry: 30 pips.
Long Exit – You can sell at the close of the bar when the high falls below the three-period SMA of the high.
Short Trades
Short Setup – You may look for price to go down to the lower band of the five-period price channel indicator.
Short Entry – You can sell short one pip below the lower band of the five-period price channel.
Short Stop Loss – A hard stop can be placed below the entry: 30 pips.
Short Exit – You may buy to cover at the close of the bar when the low is above the three-period SMA of the low.
Trading GBP/USD Trend System: Long
Long Setup – You can look for the price to go up to the five-period upper band price channel for a long setup. Look at the chart below where the upper band is blue.
Long Entry – Once you establish that the setup has happened, you can buy one pip above the five-period upper band price channel.
Long Stop Loss – A hard stop can be placed below the entry: 30 pips. In the chart below, the black line indicates the placement of the 30-pip stop loss.
Long Exit – You may sell at the open or close of the next bar if the high is lower than the three-period SMA of the high. In the chart below, you can see the trade closing at the next bars open, after meeting the criteria to exit. The three-period SMA is in red on the chart below.
Trading GBP/USD Trend System: Short
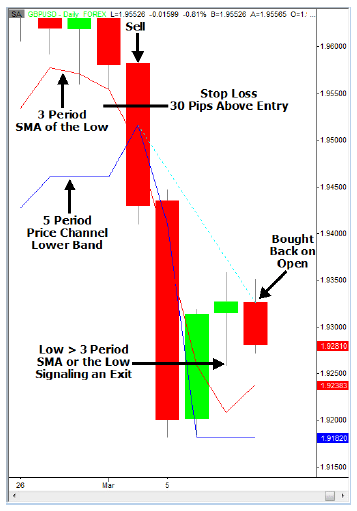
Short Setup – You can look for the price to go down to the five-period lower band price channel for a short setup. The lower band is displayed in blue on the chart below.

Short Entry – Once you establish that the setup has taken place, you may sell one pip below the five-period lower band price channel.

Short Stop Loss – A hard stop can be placed above the entry: 30 pips. The black line on the chart below indicates the placement of 30-pip stop loss.

Short Exit – You may buy to cover at the open or close of next bar if the low is higher than the three-period SMA of the low. In the chart below, you can see the trade closing at the next bars open after meeting the criteria for exiting. The three-period SMA is in red on the chart below.
Conclusion
The GBP/USD trend trading system uses the larger moves that take place in the GBP/USD, both within long-term sessions and individual sessions to help you profit. Furthermore, it uses a time-tested breakout entry system, the price channel breakout.


