ForexEzy
No Result
View All Result
  • Top Forex Advisors
    • Best Forex Robots
    • Best Forex Signals
    • Best Managed Accounts
  • Top Forex Brokers
    • Best Forex Brokers
    • US Forex Brokers
    • UK Forex Brokers
    • MT4 Forex Brokers
    • MT5 Forex Brokers
    • Zero Spread Brokers
    • Best PayPal Brokers
    • TradingView Brokers
    • Social Trading Platforms
  • Top Review Platforms
  • Forex Education
    • Getting Started
    • Forex Basics
    • Forex Trading Strategies
    • Money Management
    • Risk Management
    • Technical Analysis
    • Fundamental Analysis
    • Trading Psychology
    • Social Trading
    • Automated Trading
  • Forex Tools
    • Forex Robots
    • Forex Indicators
    • Forex Signals
    • Forex VPS
  • Forex Forecast
  • Crypto
    • Best Crypto Exchanges
    • Best Crypto Bots
    • Crypto Guides & Forecasts
No Result
View All Result
ForexEzy
No Result
View All Result
The World’s Leading Social Trading Platform
Try now
Home Forex Education Technical Analysis

How to Use the TRIX Indicator in Trading Forex

by Chintan Patel
October 7, 2021
in Technical Analysis
0
How to Use the TRIX Indicator in Trading Forex
0
SHARES
11
VIEWS
Share on FacebookShare on Twitter

The Triple Exponential Moving Average (TRIX) indicator is a two-pronged indicator. It acts as both a momentum oscillator and a trend-following tool. Like the latter, it shows the strength and direction of price momentum. As the former, it is used to point out oversold or overbought levels on a price chart. It is known for highlighting major price trends, as it only takes into account those trends that last longer than its time frame.

The Best Forex Robots Report Is Already Here!
best forex robots
Check out 30+ best expert advisors with daily updated live results and statistics
Click Here

How it’s calculated

In essence, this indicator is a triple Smoothed Exponential Moving Average. What this means is that it’s an EMA of an EMA of an EMA. Usually, an EMA prioritizes the most recent data in its calculation, which almost completely eliminates lag. When you smooth an EMA, however, it introduces lag, and every time you smooth it, the more it lags behind the price. 

Let’s assume we are calculating a 10-period TRIX. Here’s how to go about it:

Step 1: Calculate a 10-period EMA using closing prices.

Step 2: Obtain a 10-period EMA of the result obtained in step 1.

Step 3: Obtain a 10-period EMA of the result in step 2.

Step 4: Calculate TRIX by obtaining the 1% change of the triple-smoothed EMA obtained in step 3.

The result should be a fairly smooth line that oscillates above and below a zero line. Consequently, this line will be oscillating between positive and negative zones.

How it functions

As aforementioned, TRIX has two functional abilities. In following trends, when TRIX is oscillating in the positive zone, it means that prices are in an uptrend. The bulls have the upper hand whenever the TRIX line is in the positive region. In the same way, when its value is in the negative zone, it denotes that prices are in a downtrend and bears have the upper hand. 

TRIX also works as an oscillator to mark potential peaks and troughs. When it strikes extreme positive levels, it denotes overbought conditions, which may signify an impending downturn. When it hits the extremities in the negative zone, it denotes oversold conditions. This could be a sign of an incoming bullish reversal.

How to obtain signals from a chart

Crossing the zero line

As aforementioned, while TRIX is in the positive region, it signifies that momentum is leaning towards the bulls while the negative region means bearish momentum is winning. Therefore, when the indicator crosses the zero line from below, this is a sign of a shift in the market sentiment. At this point, traders can open long positions as prices will most likely be rallying.

Alternatively, a zero-line cross from above indicates a waning bullish momentum and, in its place, a strengthening bearish sentiment. When the indicator crosses below this line from above, traders will be looking to open short trades to take advantage of the resultant downturn.

Crossing a signal line

To fine-tune this indicator’s accuracy, traders often use a signal line in conjunction with the TRIX. This signal line is essentially a Moving Average of the TRIX. For this reason, this signal line tends to lag behind it. 

Signals are obtained whenever our indicator crosses this signal line. A cross above this signal line yields buy signals, as prices begin to rise following this cross. Similarly, a cross below the signal line will indicate that prices are embarking on a downturn, which gives sell signals.

These signals are useful in both trending and consolidating market periods. When the market is trending, a crossing of the signal line shows the end of a price retracement and the resumption of the prevailing trend. During consolidation, TRIX hovers around the signal line, showing that support and resistance levels are currently holding.

Divergence from price

When the price is trending upwards but the TRIX line is headed downwards, that is usually a bearish divergence. More often than not, it precedes a downturn in prices. Similarly, when prices are trending downwards, but the TRIX indicator is in an uptrend, it signifies an incoming bullish reversal.

Combination with other indicators

Signals obtained from TRIX can be useful in trading, but if they are confirmed by other indicators, their chances of success improve significantly. For this reason, most traders combine this indicator with other oscillators such as RSI and MACD.

TRIX + RSI

From the example below, we can see the entry signal on 30th July when RSI recorded overbought conditions for the EURUSD pair. Shortly afterward, TRIX was also overbought, and then it started on a downturn. This confirmed the signal to enter a short position.

3-hour EURUSD chart showing the TRIX and RSI blend.

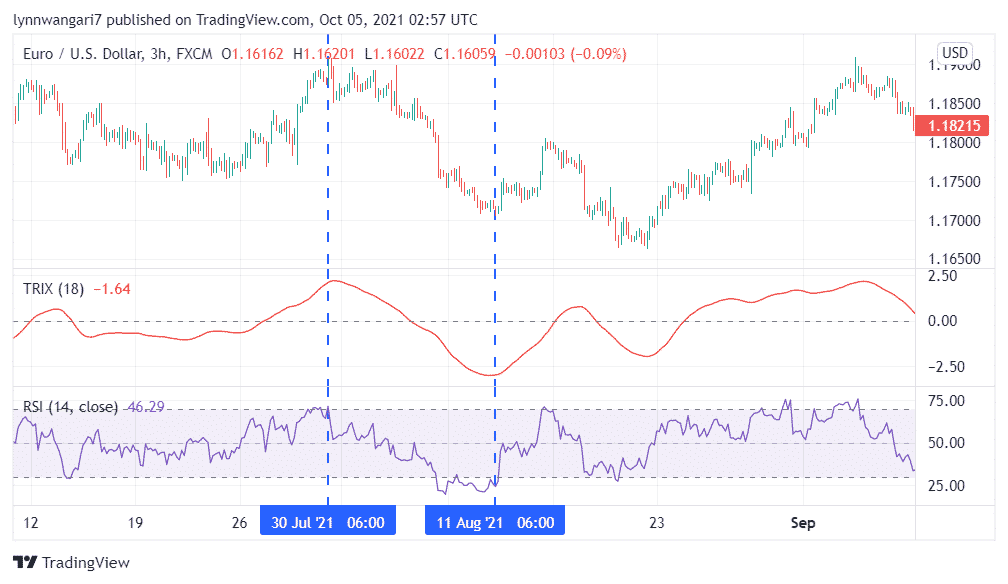
On 11th August, the RSI was oversold for a while before it embarked on an uptrend. Similarly, the TRIX indicator troughed, confirming that our currency pair was indeed oversold. This confirmed the exit of our short. True to this prediction, prices went bullish shortly afterward, marking the end of our bearish run. 

TRIX + MACD

In the example below, we see the MACD cross below its red signal line on 16th June, giving our first bearish flag. Shortly afterward, the TRIX line plummeted and crossed below the zero line. This was a confirmation of the signal to go short.

3-hour CHFJPY chart showcasing the TRIX + MACD blend.

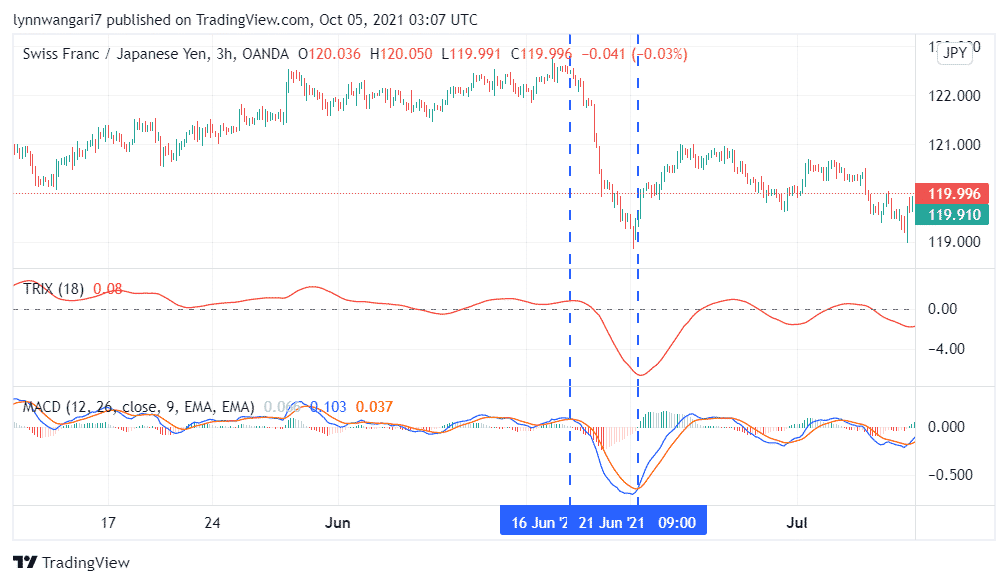
On 21st July, the TRIX indicator reached a trough, signifying that the CHFJPY pair was oversold. Further, the MACD made a bullish crossover pattern, which confirmed the end of our downtrend. This was the signal to close our positions and take profit.

Conclusion

The TRIX indicator can be used as a trend-following tool and as an oscillator. It gives signals by crossing the zero line, making crossovers with a signal line, or through divergences with the price. For increased signal accuracy, this indicator is often used in collaboration with the RSI or the MACD.  

The Best Forex Robots Report Is Already Here!
best forex robots
Check out 30+ best expert advisors with daily updated live results and statistics
Click Here
ShareTweet
Previous Post

Top 6 MetaTrader Brokers for Forex Expert Advisor Trading

Next Post

Best Cent Accounts Forex Brokers

Related Posts

Trading With Balance of Power Indicator

Trading With Balance of Power Indicator

by Adam Stanley
December 9, 2021
0

The Balance of Power (BOP) indicator is an analysis tool created by Igor Livshin in August 2001. It tracks the...

What Are Pennant Chart Patterns in Forex: Step by Step Guide

What Are Pennant Chart Patterns in Forex: Step by Step Guide

by Chintan Patel
November 15, 2021
0

Continuation patterns in the forex market are a common occurrence whenever there is a large movement in one direction followed...

How To Trade Ascending Scallops in Forex

How To Trade Ascending Scallops in Forex

by Adam Stanley
November 10, 2021
0

Price in the Forex market does not always move in one direction. After a significant move in one direction, up...

Inverted Scallops in Forex Chart Patterns: Step by Step Guide

Inverted Scallops in Forex Chart Patterns: Step by Step Guide

by Adam Stanley
November 9, 2021
0

Whenever prices move up significantly in the forex market, exhaustion often kicks in. In most cases, the fatigue is usually...

Elder’s Method in Forex Trading

Elder’s Method in Forex Trading

by Tim Baudin
November 3, 2021
0

There are several strategies that traders and analysts have developed over the years, all in a bid to milk the...

Load More

Leave a Reply Cancel reply

Your email address will not be published. Required fields are marked *

Best Forex Automated Systems

  • TechBerry 9/10
  • Happy Galaxy 8.5/10
  • Forex Cyborg 8.5/10
  • Forex Fury 8/10
  • FXgoodway 7.5/10
  • Best Forex Brokers
  • Best Forex Robots
  • Best Forex Signals
  • Best Forex Managed Accounts

Top Trading Markets

We are dedicated to demystify the world of forex trading for you – no matter what level you are on.

Categories
  • Automated Trading
  • Crypto Robot Review
  • Cryptocurrency Trading
  • Day Trading
  • Forex Basics
  • Forex Brokers
  • Forex Education
  • Forex Forecasts
  • Forex Indicators
  • Forex Market Commentary
  • Forex Robots
  • Forex Signals
  • Forex Signals
  • Forex Tools
  • Forex Trading Strategies
  • Forex VPS
  • Fundamental Analysis
  • Managed Accounts
  • Money Management
  • News
  • Review
  • Review Platforms
  • Risk Management
  • Social Trading
  • Technical Analysis
  • Top World Traders
  • Trading Apps
  • Trading Psychology
  • Uncategorized
Tags
Acquisition AI Amazon Apple Artificial Intelligence Bitcoin bond yields CEO China earnings earnings report economy Electric Vehicles Federal Reserve financial performance Financial Results forex ea forex software reviews Growth Guidance Housing Market inflation interest rates Investing investment Investors Market Volatility merger mortgage rates net profit Nvidia Oil prices Q2 Results revenue Revenue Growth Sales sales growth Stock Futures stock market stock performance Stocks strategies technology Tesla Video
  • Terms of Use
  • Privacy Policy
  • Compensation Disclosure
  • Risk Disclosure
  • About Us
  • Contact Us

Copyright © 2023 by ForexEzy.com

No Result
View All Result
  • Top Forex Advisors
    • Best Forex Robots
    • Best Forex Signals
    • Best Managed Accounts
  • Top Forex Brokers
    • Best Forex Brokers
    • US Forex Brokers
    • UK Forex Brokers
    • MT4 Forex Brokers
    • MT5 Forex Brokers
    • Zero Spread Brokers
    • Best PayPal Brokers
    • TradingView Brokers
    • Social Trading Platforms
  • Top Review Platforms
  • Forex Education
    • Getting Started
    • Forex Basics
    • Forex Trading Strategies
    • Money Management
    • Risk Management
    • Technical Analysis
    • Fundamental Analysis
    • Trading Psychology
    • Social Trading
    • Automated Trading
  • Forex Tools
    • Forex Robots
    • Forex Indicators
    • Forex Signals
    • Forex VPS
  • Forex Forecast
  • Crypto
    • Best Crypto Exchanges
    • Best Crypto Bots
    • Crypto Guides & Forecasts

© 2023, Forexezy. {copy} {year}