
Anyone wanting a career in Forex trading is bound to come across the terms ‘support’ and ‘resistance’ on a daily basis. But unfortunately, those who don’t know exactly what they mean might end up having their own definition of them, which can greatly upset their trading plans. These terms are an indispensable part of chart analysis since they are utilized by traders to refer to levels that act as barriers.
But, even though the main idea behind them can seem relatively straightforward at first, one will find that these come in various forms, and the idea is a bit trickier than is assumed to be. So, without further ado, let’s get straight to them.
What is support and resistance in Forex trading?
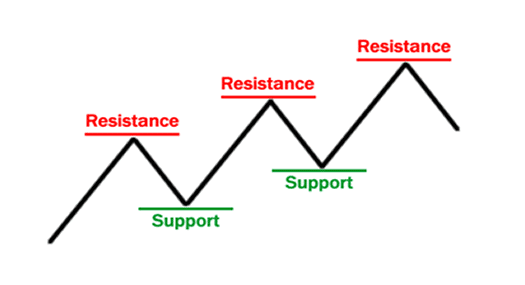
The level at which a downtrend can be anticipated to pause mainly because of demand concentration is known as support. When the price drops, the demand automatically rises, which leads to the formation of the support line. On the other hand, the area of resistance comes up when prices have gone up, and there is much more interest in selling.
When such areas are recognized, the corresponding price levels become possible entry/exit points. This is because when the price reaches either of these areas, it will either bounce away from it or keep moving in the same direction until it reaches the next support/resistance area.
It is the belief of traders and their timing that determines how and when they make their trades. Regardless of whether the price is blocked by these levels or ends up breaking out, traders wager on the direction and ascertain whether they have been correct or not. They close the trade if it is moving in the wrong direction for a little loss. But, if it moves in the direction of their position, their profits can be quite substantial.
Major vs. minor support and resistance levels
Let us now look in detail into the difference between the two types of resistance levels.
Minor support and resistance levels
Minor support/resistance levels cannot hold the price action for too long. For instance, on a downtrend, the price will mark a low, then bounce back up, and then begin to fall again. The minor support area is that low since the price stalled and bounced back up. However, since the trend continues downward, there won’t be much problem with it continuing downward.
Such areas of minor support/resistance allow for insight into possible opportunities. In the above instance, the downtrend is maintained as the price falls through the minor support. But, if it starts to stall and bounces only at or nearer to the previous low, a range may be on the cards. If it starts to stall and bounces above the previous low, we are left with a higher low, which implies that there is a potential change in the trend.
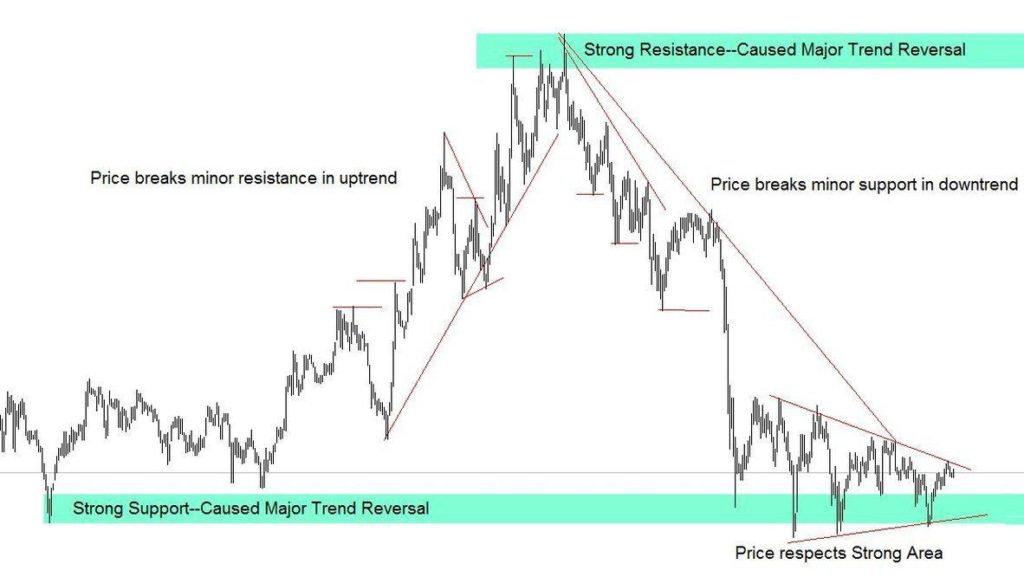
Major support and resistance levels
The major support/resistance areas ensure that trends are reversed. If it was in an uptrend but then ended up being reversed, the point at which that happened is the strong resistance area. Conversely, the point at which the downtrend ends and reverses is the strong support area. As soon as it comes back to a major support/resistance area, it will find it difficult to move through and find its trend reversed.
Using Trendlines
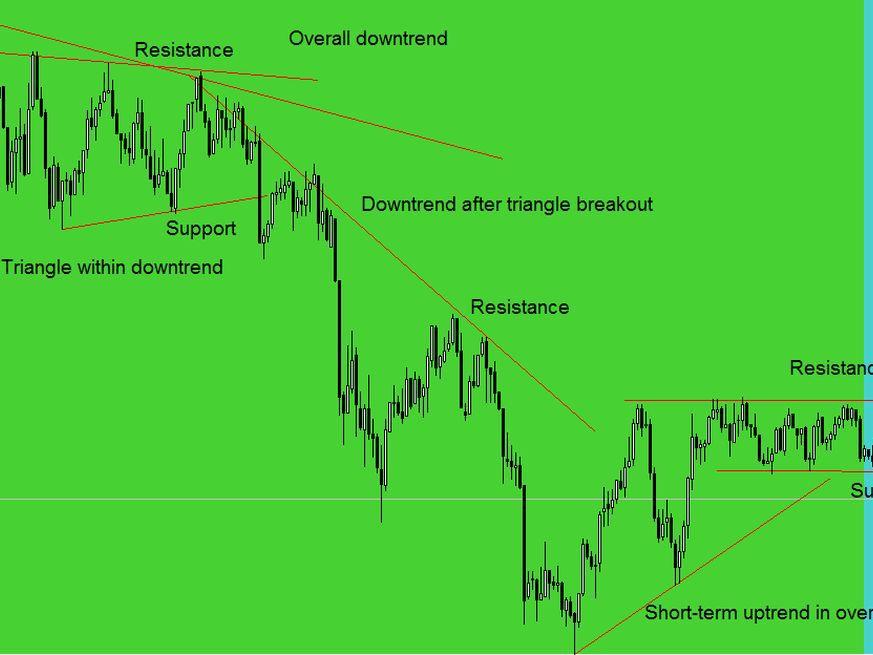
These areas are showcased with trendlines, which can be either angular or horizontal. When the price is stalling and goes back to the same area a couple of different times in a sequence, a horizontal line is marked to highlight that the price is finding it hard to move beyond that area.
In a trend, look to link together the highs as well as the lows. Thereafter, extend those lines out to check where the price may end up in the support or resistance areas. Such lines end up determining the number of chart patterns that enable a trader to get a visual representation of what the market is doing and what could happen in the near future.
False Breakouts
There are also times when the price will move beyond the expected area. Although it is not a frequent occurrence, it does tend to happen from time to time and is regarded as a false breakout. It is crucial to realize that support/resistance is not an exact point but an area where the price action is expected to reverse.
Some unpredictability is to be expected regarding the price in these areas. But, such breakouts provide amazing opportunities for trading. One strategy involves waiting for such a breakout to occur before entering the market.
For instance, if the action is of an uptrend and the price is pulled down to support, wait for it to break below the support area and go ahead to buying as soon as it starts rallying back up.
The converse strategy can be utilized when the action is in a downtrend and begins to pull up to the resistance area. Wait for it to go beyond that area and then sell, as it begins to go back down.
However, caution should be maintained when utilizing such an approach as such breakouts don’t occur frequently. If traders are waiting for it, they may end up missing out on decent trading opportunities. That is why it is good to take the opportunities that come, and if one happens to catch a false breakout, all the better.
Final words
Support/Resistance levels are easily some of the most crucial ideas that traders utilize to conduct technical analysis. The support level can be seen as the floor, while the resistance is the ceiling. When represented graphically, they provide important visual cues so that traders can identify where the market is about to turn and what needs to be done to profit from such a movement. Knowing about these areas/levels can enable you to keep an eye out for false breakouts as well and work through them to further improve returns.


