They say expectations drive the market. We’ve seen risk assets growing lately, along with ever-improving economic data from the US. What happens when the prices sway too far ahead of time? Some would say, “That’s enough,” and cover their positions.
Although, according to the Fed’s Statement on Wednesday, April 28th, “Indicators of economic activity and employment have strengthened,” the regulator didn’t change the stance. The Committee decided the rate would stay at 0.25%, and monthly asset purchases of $120 billion would continue.
Let’s see how the smart money, the bond market, responded to the good news for risk assets. Bonds are usually among the first that respond to economic factors.
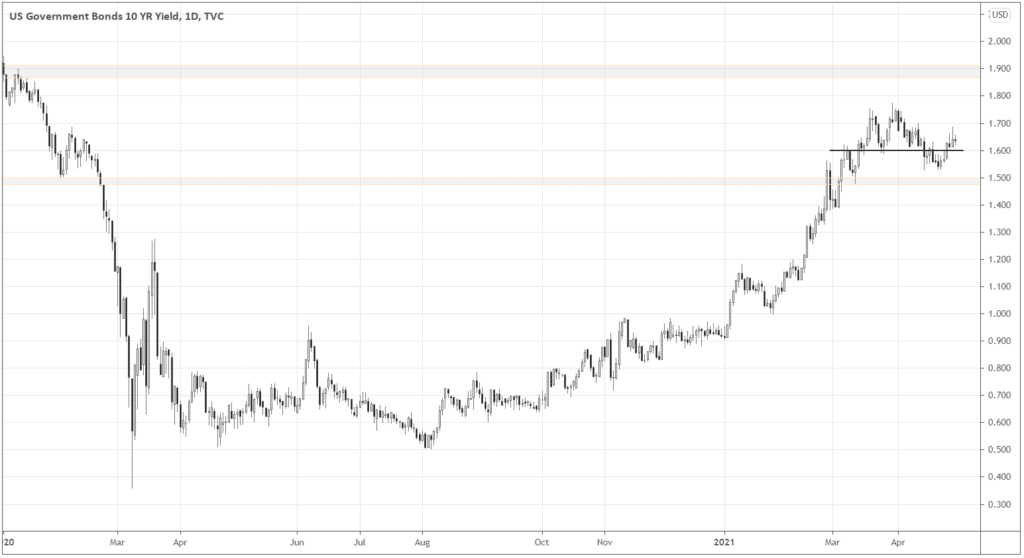
The 10-year yields had recovered for several days before the Statement, getting back above 1.6%.
When we zoom in after the Rate decision, we see the initial yields spark above 1.65%, as traders tried to bet on the recovery narrative. Risk-off traders aggressively subdued the impulse, sending rates to 1.61%
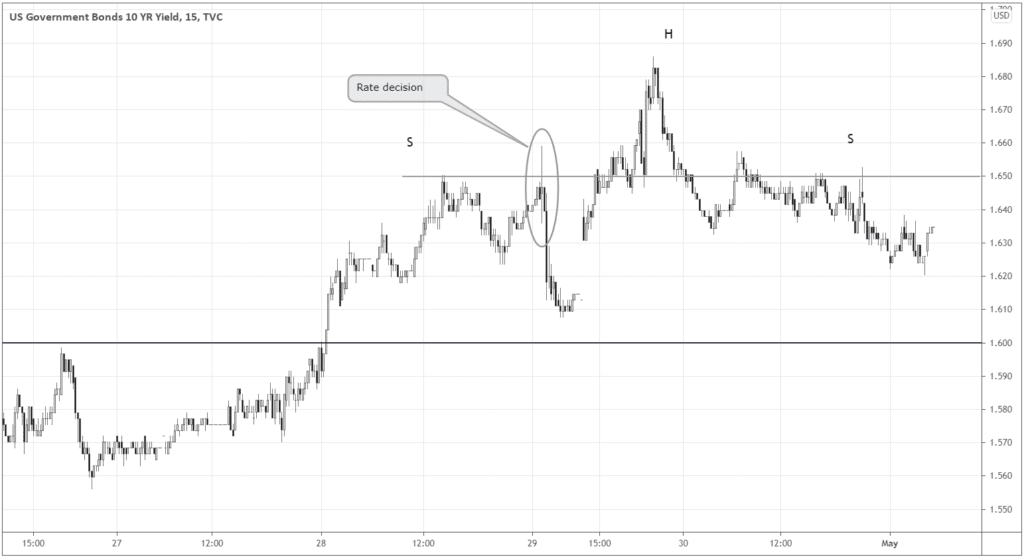
The market attempted to get above the key 1.65% level again but was overcome by the end of the session. The whole thing now even looks like Head and Shoulders – a bearish reversal pattern. It tells us that the market’s old sentiment doesn’t fit many other traders’ outlooks.
If we look at the recent data releases, the readings are better than before but not as good as analysts expected in the three out of four indicators.

Does it mean the economy is a little overheated at this point? Consumer Confidence, as it keeps beating all estimates, could be another piece of evidence. When consumers get surveyed about the economy, they express their perceptions that might not be accurate. On the contrary, the hard data of the previous three indicators is a more objective metric.
Simply put, we can observe the tendency of both consumers and professionals to overestimate the current state of the economy.
The second camp, let’s say a pragmatic one, choose to be more conservative. They might’ve had enough of the risk-on price move and want to take profits or even short-sell the optimism.
DXY and the Level to keep an eye on
Here let’s see how the sentiment shift showed up in the dollar index prices. The index has declined for a while, until the last day of the month.
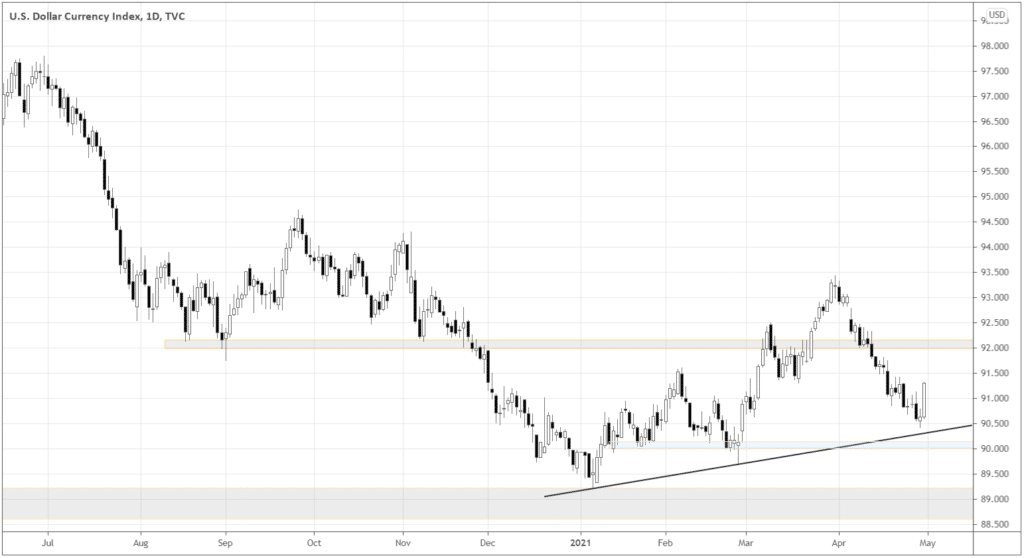
How come the dollar retreated like that, though the economic outlook is positive (too positive)? Technically, there are things to bounce off from. Look at the trendline and the 90.0 support nearby.
When dollar bears got their profits, their zeal to manage risk likely overcomes opinions about the economy… So, the buyback!
The DXY reversal developed beautifully – look how it interacted with the 90.80 level!
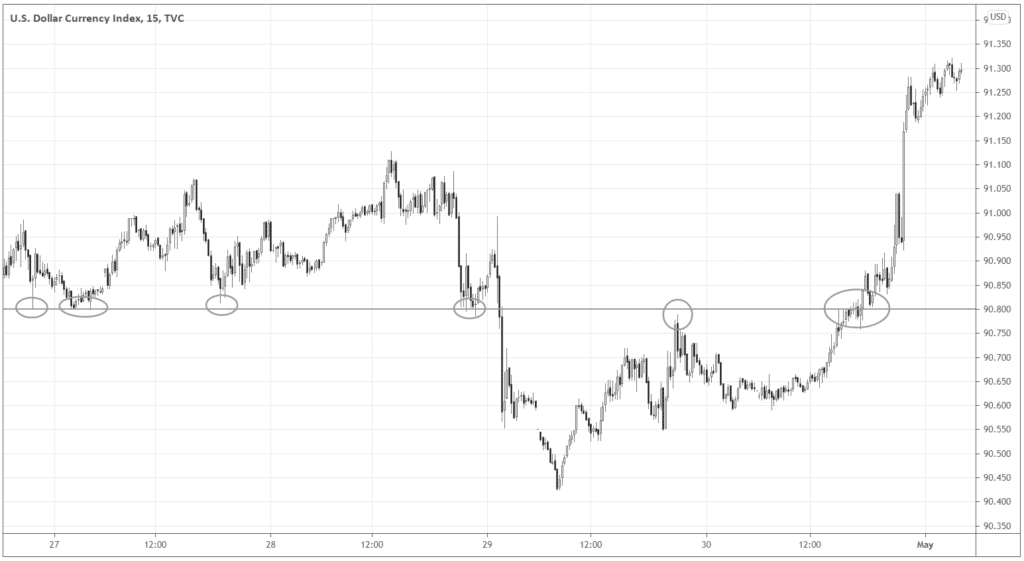
You want to take such prices seriously – respect and honor it! Next time the market approaches the level, something interesting may happen, so set your alerts over there.
Risk gauge
To illustrate the current risk sentiment, give a glance at the pairs below. The gauge shows “risk-on” when Aussie and copper grow against their denominators.
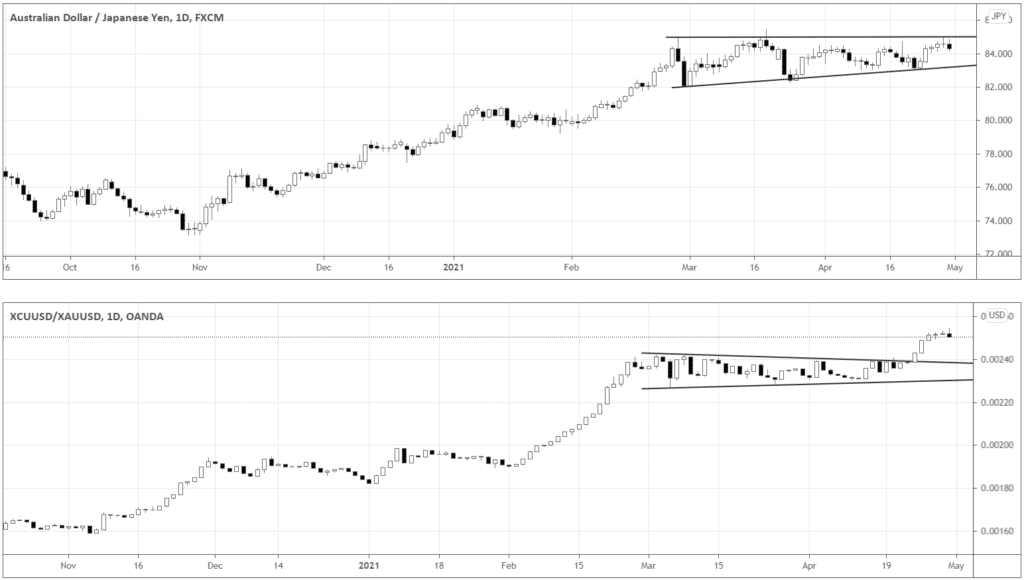
Although copper broke out the consolidation’s upper boundary, AUD didn’t follow. We can be confident about the risk mode when both pairs act similarly.
As AUDJPY is still sideways, the market is digesting gains and may not be the best for trend followers and momentum traders.
Are we on the uptrend? – Yes!
Should we act now? – Not really.
A look into European stuff
If you’re still eager to do something, at least don’t wake a sleeping lion.
There is an appealing weakness in DAX, and you may even get excited about the H&S pattern formed.
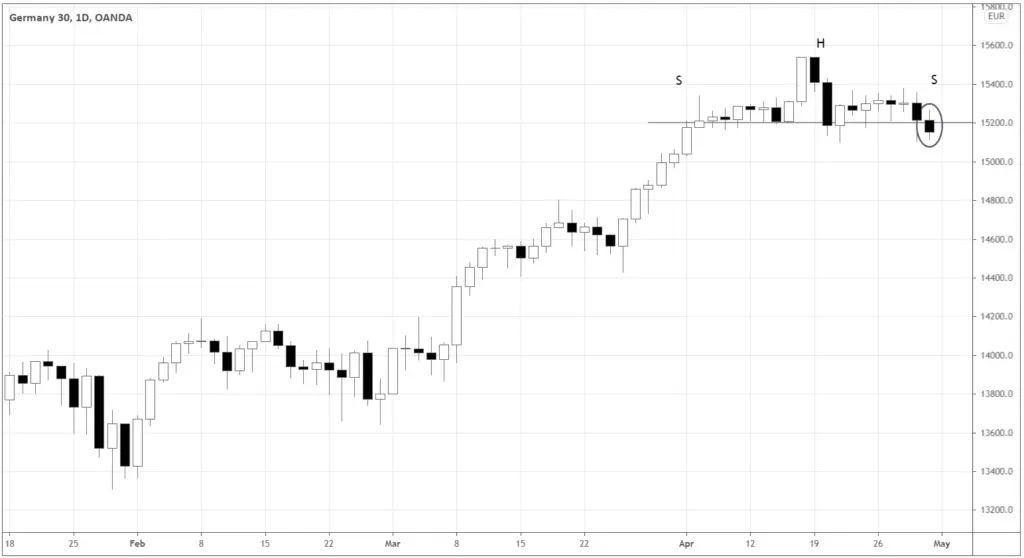
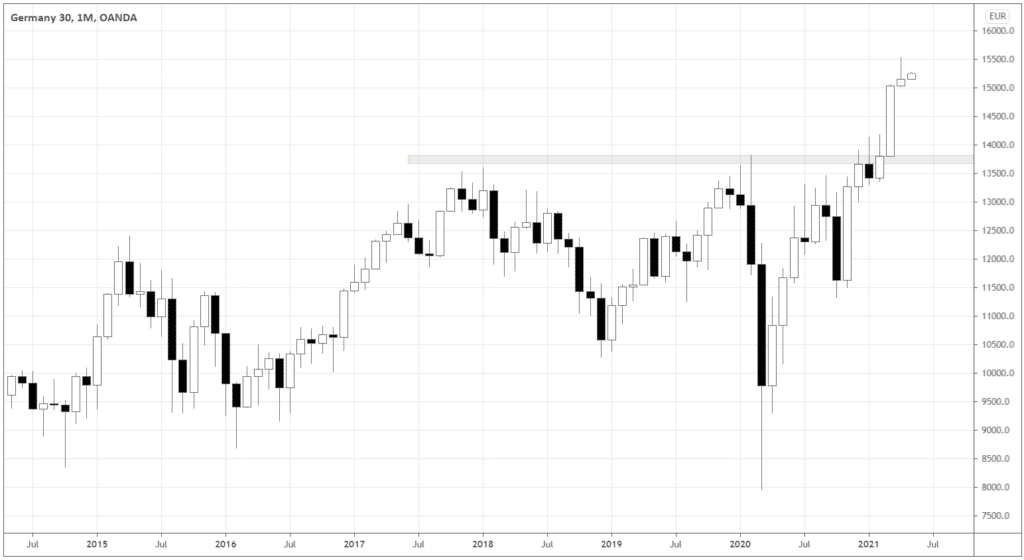
But, don’t forget that the index recently broke out from an almost 4-year base and could be at the beginning of the bull market.
Instead, look at the EURGBP chart below. Consider the H&S near the down boundary of the long-term channel.
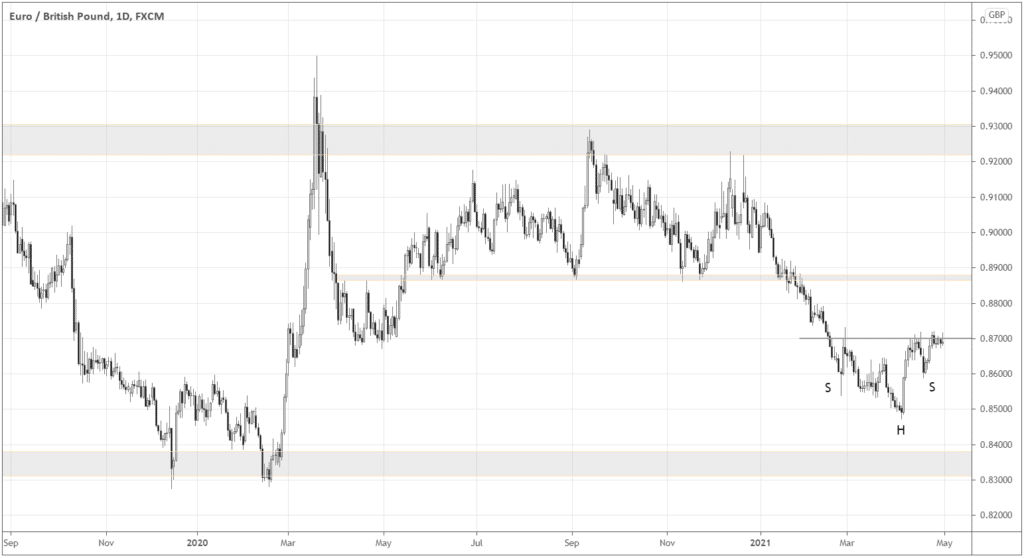
EUR could act as a safe-heaven here, so it makes sense to buy the currency when H&S resolves above 0.87.


