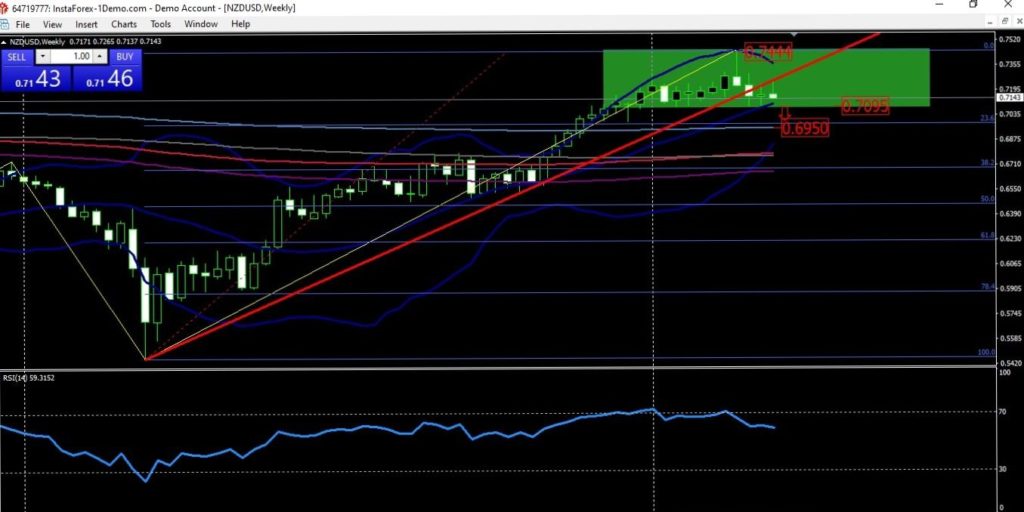
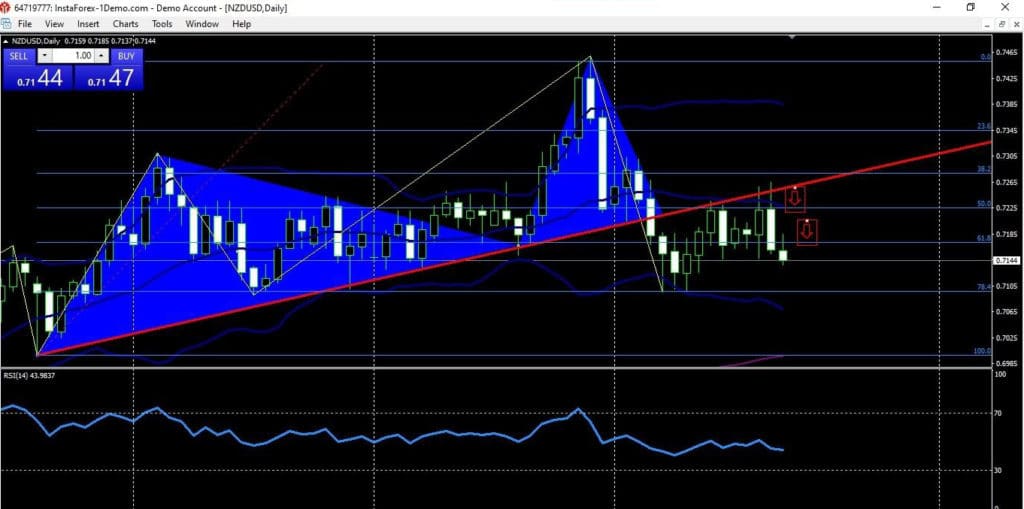
- NZD/USD has a similar broken trend line area retested this week on the daily chart and weekly charts like AUD/USD.
- The weekly price is facing support near the weekly Bollinger middle band area. If the price goes, it will drag near the 0.6950 area, and weekly 200 periods smoothed moving average support (blue line).
- Around the 0.7100 regions, the latest three-week-old strong support awaits as the price is falling for two consecutive two days sharply.

When the midnight Wednesday FOMC was meeting held, the dollar showed huge weakness, and NZD/USD raised near the 0.7270 area, a four-month-old ascending trend line broken area. Prices bounced from the region and are now falling sharply around 0.7144 in less than two days. Daily 61.8% Fibonacci support has been crossed below and now heading towards the 78.4% daily Fibonacci support near the 0.7100 regions. Daily RSI is below 43, and weekly RSI is falling from overbought conditions to 59 areas.
Today USD is growing despite negative data of US jobless claims, increasing from 725k to 770k. But the fastest vaccination in the US has reduced restrictions, and the economy is on the way to grow. In these circumstances, NZD/USD has the most probable direction to fall.
Traders have an excellent opportunity to sell from the current price as price returned from the broken trend line area in both the charts. Sell from 0.7144 and target near 100% daily Fibonacci support around 0.7000 regions and stop misfortune around 0.7230 area.

NZD has shown significant gains against the USD in this week’s Asian session. It built a corrective momentum when it managed the record drop at the end of the week. Approximately 0.41% was added and 0.7030 active breakup level. NZD is actively growing in New Zealand in the context of publication because of its weak macroeconomic statistics. On the other hand, USD still receives support from data published on Monday. With the forecast decrease of 12.1 points in March, Dallas Fed Manufacturing Business Index (DFMBI) rose to 28.9 points from 17.2.
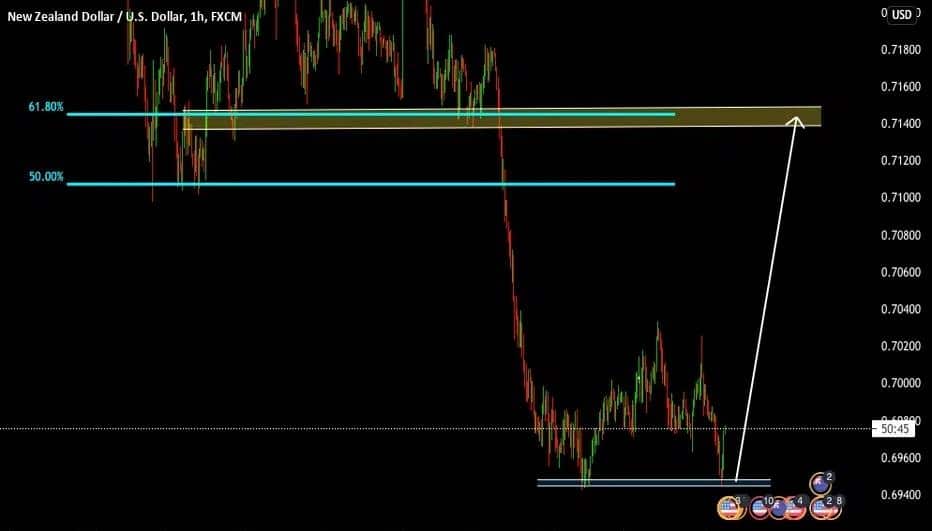
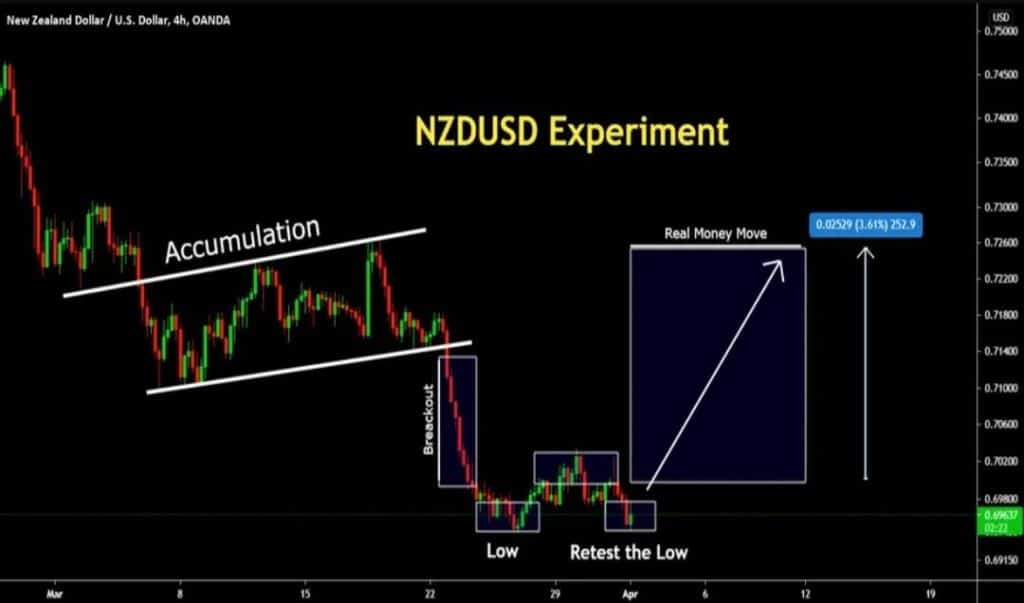
On the hourly chart, NZD/USD is touching the 200 periods lowermost moving average resistance. And on the four-hour chart, the price touched a five-week-old broken descending trend line. From these conditions, the NZD is quite stronger today than the USD; hopefully, the price will fall slowly. As NZD can’t hold the strength up for a very long period. But USD is growing stronger from the first of this week, and all USD-based currency pairs are falling very sharply.

The upward movement on the pair continued; the bulls reached 0.7031, with some strengthening of the New Zealand dollar due to the Chinese economy’s growth. However, the US dollar is gaining momentum, an uptrend, and the recovery rate is clearly higher than that of the NZD. According to the greenback, there will be important news – changes in the number of employees in the non-agricultural sector from ADP, crude oil inventories, and the index of pending sales in the real estate market, I expect, will further strengthen the US dollar. Therefore, for the bearish movement on the pair, in the long term, to the support of 0.6844, on the D1 timeframe.
It will be possible to get into long positions, to get a profit from the recovery growth. The obstacle will be at 0.7090, where those set to sell will take a step towards short positions, and then the pair will continue the southern trend. Otherwise, we will overcome the resistance, and the bulls will rush again to the resistance Н4 0.7230. Of course, the positions of the American dollar are strong now, but there is no guarantee of further strengthening, especially since the pair is oversold. On all fronts, the last week of March stood out for commodity and highly profitable currencies with losses.


