- New Zealand has seen a rise in the disparity between income levels and housing prices.
- Beneficiary households in NZ spend close to 30% of their income on rent, with housing/ utility prices up 0.9% in June 2021.
- The Japanese yen also rose against major currencies, including CHF, AUD, and CAD.
The NZDJPY pair dropped 0.45% as of 2:20 am GMT on July 27, 2021, from the previous day’s close. It opened at 77.48 and traded to a low of 76.93. At the same time, the NZ dollar also traded to a low of 0.30% against the US dollar, indicating a weakening kiwi.
New Zealand is staring at a housing bubble as homeownership skyrockets. There is a disparity between income levels and the prices of houses.
Reduction of interest rates
The Reserve Bank of New Zealand (RBNZ) announced that mortgage holders in NZ had increased their cash-in-hand balances since the reduction of interest rates in 2016. Individuals that lacked mortgages had their income levels lowered due to the imposition of low deposit rates. For holders of mortgages, cash-in-hand is expected to rise by 1.0%, while those with no mortgages would have their deposits declined by 0.4%. Deposit savings attract lower incomes.
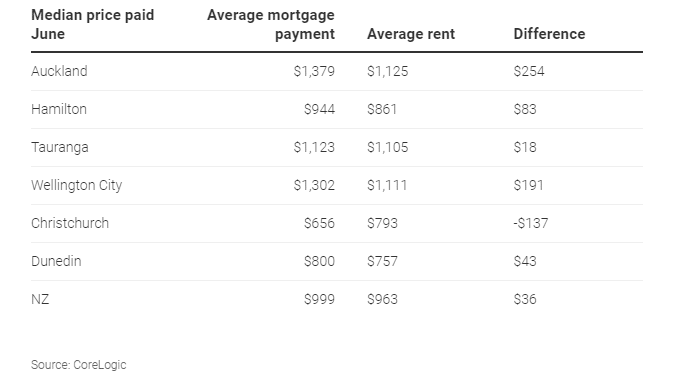
The over-emphasis on mortgage acquisitions has seen mortgages rise exponentially above rent levels in New Zealand. Based on a 2.5% mortgage, we will compare fortnight repayment plans against rentals (on a repayment period of 30-years) across different states in NZ.

Figure 1: 30-year repayment plans-mortgages vs. rentals in NZ
Out of the seven cities in figure 1, only Christchurch had rental payments that were higher than mortgages. Tauranga scored the least difference at NZ$18. However, the push to have higher mortgages has increased average rent across New Zealand.
According to Barfoot & Thompson (a property manager in NZ), rental payments in Auckland have increased by an annual rate of 3%. April 2021 saw weekly rental payment rise to NZ$600, with June’s payment rising to NZ$605.
Inflation
The quarter ending June 2021 saw household-based inflation soar 1.1%. High prices of petrol-fueled transport costs by 2.8%, especially for the low to middle-spending housing groups. For those in the least spending housing categories, transport prices inched up 2.3%. Housing and related utility prices surged 0.9% in the quarter, while food prices rose 1.3%. General transport costs increased 3.0%.

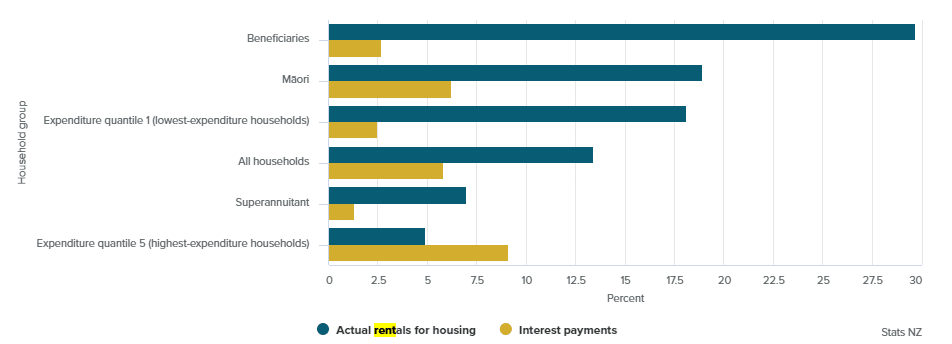
Figure 2: Household expenditures on NZ rentals
Beneficiary households – those receiving government support, spend close to 30% of their income on rents (as seen in figure 2). Maori households follow at 19.9%.
Japan’s CPI data
The Bank of Japan (BoJ) raised its core CPI to 0.1% from 0.0%. At this rate. The core consumer prices fell below the BOJs target despite an increase of wholesale prices by 5.0% in June 2021.

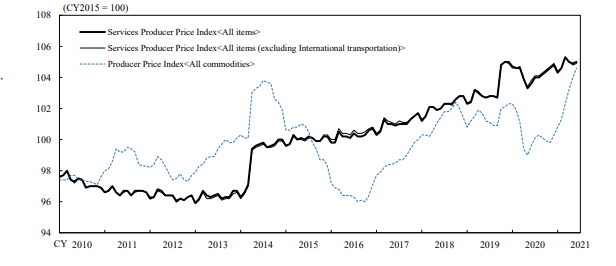
Figure 3: Japan’s Service Producer Price Index
June 2021 saw the Services Producer Price Index (SPPI) gain 1.4% (YoY) to stand at 105.0 for all items in Japan. Excluding international transport prices, the SPPI gained 1.1% (YoY) to 104.9. The corporate service price index (CSPI) also rose 1.4% in June 2021 (YoY) from a previous record of 1.5%.
As of 3:36 am GMT on July 27, 2021, the Japanese yen had gained 0.86% against the NZ dollar and 0.55% against the Canadian dollar. The JPY also inched up 0.34% against the Swiss franc and 0.69% against the Australian dollar.
Technical analysis
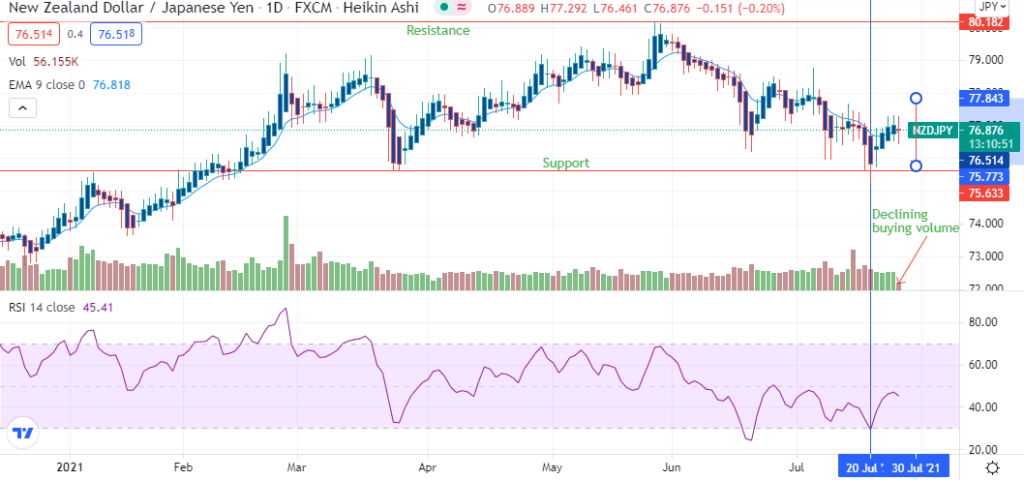
The NZDJPY found support at 75.63, with the price piercing this level on July 20, 2021, before continuing the uptrend.

There is a decline in buying volume, with the 14-day RSI close to the neutral zone at 45.41. We may see a drop as the pair moves again towards the support region around 76.51. The 9-day EMA is at 76.82, indicating a downtrend that may pull the price to 75.77 before seeing buyers stepping in again.


