A seasonal pattern in the context of financial markets refers to certain timeframes during which the prices of some assets act in a consistent fashion, resulting in the formation of a pattern. The fact that these patterns are repeated and have a high likelihood of recurrence is the most significant factor in establishing their seasonality.
As a result of seasonality, the stock market and some specific assets tend to perform better at certain times of the year than others.
Seasonality is defined as a regular price fluctuation or trend that occurs more than once in a 12-month period. There can be variations in the seasonal trends of the financial markets based on yearly fixed periods such as certain months or weeks, predicted corporate calendar events such as earnings reporting seasons, and climate-triggered market seasonality such as winter and summer.
These seasonal market patterns can be calculated as an average gain or loss for a specific time for the studied financial asset, such as saying that crude oil prices rose in 17 of the last 20 summers.
There are seasonal trends in nearly every financial sector, from the foreign exchange market to commodities markets to the stock market. The following are some of the expressions used to refer to well-established seasonal market fluctuations:
- “Sell in May and go away”: This expression refers to the selling of shares in May, followed by a quick comeback to the market in October.
- December’s stock market rally is known as the “Christmas Rally.”
- Stock prices often rise in January due to what is known as the “January effect.”
Agricultural raw resources, for example, are financial instruments where seasonal models are significantly more relevant due to the cycles of planting, harvesting, etc. During particular seasons of the year, supply and demand models play a significant role in determining trade policy.
Investing in gold during the winter
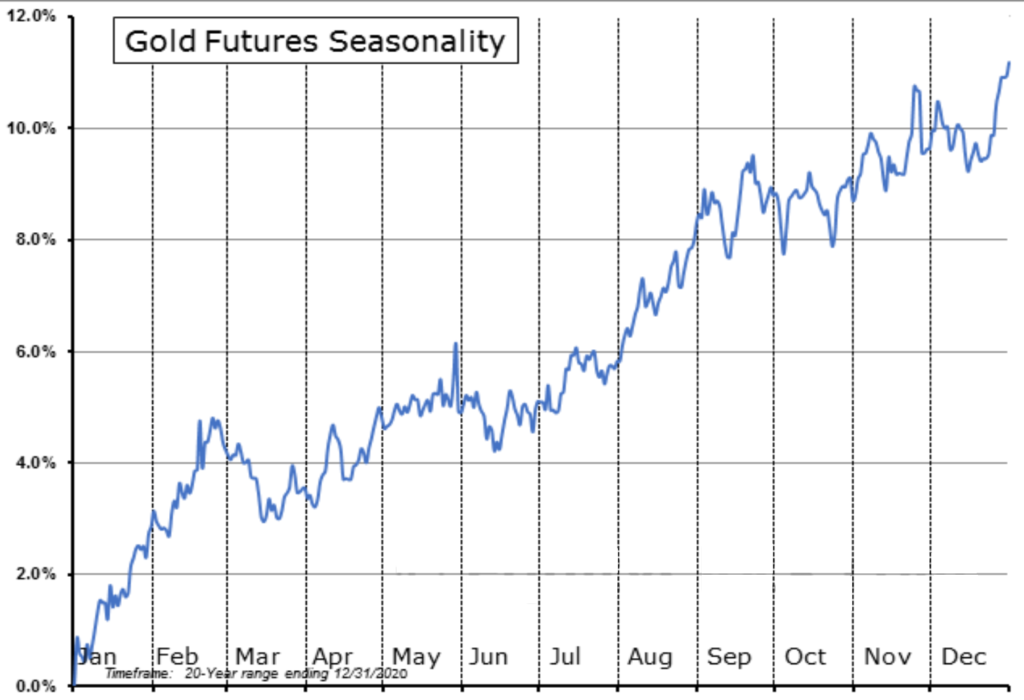
Although gold has been demonetized to a significant extent, most central banks continue to hold it in reserve. August is the strongest month for gold, and in 15 of the previous 20 Augusts, the yellow metal’s value has appreciated. There have been an additional 14 appreciations in January and April in the last 20 years.

The chart above clearly shows what the following findings are:
- August, September, January, and February are historically strong months for gold.
- March through July is the typical range trading period for gold.
Oil’s seasonal patterns
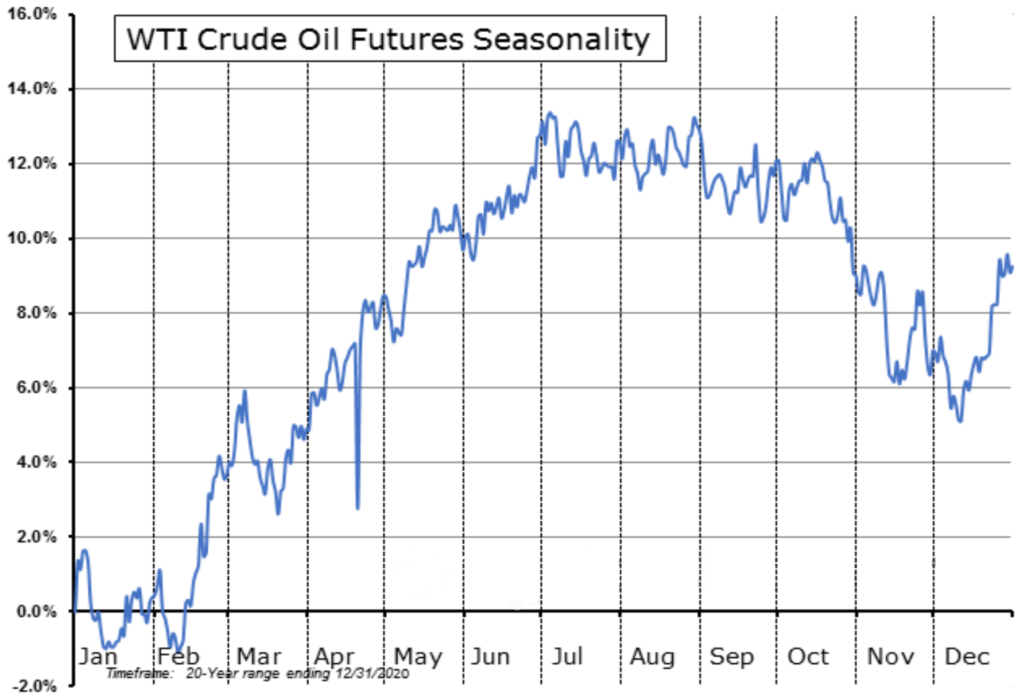
Commodities like oil, which are traded on the financial markets in large quantities, also have seasonal patterns that might be intriguing to certain traders and investors alike. WTI crude oil’s price movement for the previous 20 years may be seen in the chart below:

From the chart above, we can deduce the following:
- WTI crude oil prices typically climb over the first half of the year, between February and June.
- WTI has historically performed poorly in the fourth quarter.
There are also seasonal tendencies for many other commodities that traders can use to determine when to begin and exit trades.
Seasonality in the Forex market
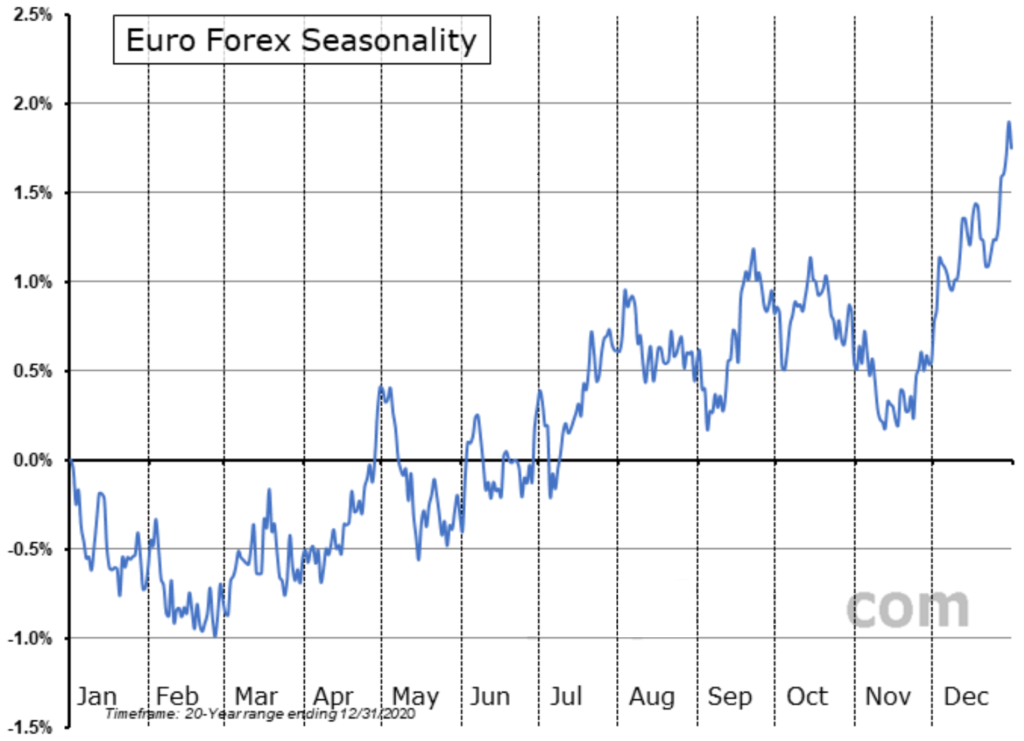
Globally, the forex market is the largest, with daily trades amounting to about 6 trillion dollars. The EURUSD pair, due to the economic strengths of the Eurozone and the United States, is the most traded pair by volume. The chart below shows the seasonal pattern of the pair over the last two decades.

From the graph, we can deduce the following about the pair:
- January and February are typically bad months for EURUSD.
- The three months of March, April, and September appear to be historically favorable for EUR/USD.
Seasonality and trends
Both the trend and seasonality are critical elements of a time series since they can be used to forecast price movements. They’re not exactly the same, though.
When we talk about the trend, we’re talking about the series’ tendency to increase or decrease linearly with time. It displays whether the asset’s price is moving up or down. However, seasonality refers to recurring patterns or cycles in behavior throughout time.
Seasonality trading strategies: a guide for investors
- As a market filter, seasonality patterns can be used to ensure that you avoid markets that are adverse for your business at any given time of year. Losses will be reduced, as will the amount of drawdown in your portfolio. On the other hand, you are likely to realize increased profitability.
- Determine your leverage by looking at seasonal patterns. If the asset is in a good or bad season, you may decide whether to boost or decrease your leverage. You can utilize greater leverage to raise the size of your investment when there is a favorable time for the asset.
In summary
Several assets in the financial markets have a tendency to peak and fall during specific months or seasons. Seasonal trends can help traders get the most out of the markets during the growth and decline seasons by taking the right trading positions.


