One of the best ways to know what’s happening to a security’s price is to follow its trends. As a trader you tend to make a lot of money when you buy during the formation of an uptrend and sell when the uptrend peaks. However, one of the most important things here is to define the trend for yourself. A trend can be anything from as small as six bars to hundreds of bars on a weekly chart.
The development of a trading system is forex is all about trial and error where traders can make systematic changes on a step-by-step basis which improves results over time. The general rule of thumb is to never trade against a trend following indicator after applying it to a chart. If the price is above the indicator, never go short. Similarly, if it is below the indicator, never buy.
Making the trend your friend
A simple glance at most charts will give you an idea that in some time frames, the prices of securities tend to move in trends. These trends usually persist for a long period of time. A trend can be defined as a discernible directional bias in price, which can be upwards, sideways, or downwards. In case you cannot see the trend, you can widen the time frame from a few days to several months, or narrow down the time frame from days to hours.
During trading, the trend is a trader’s friend. Your chances of making money increase a lot when compared to when you go trendless. The identification of a trend can help a trader perform two core functions.
Capital Creation
As a rule of thumb, buy securities only when their prices are rising, or are in an uptrend. Buying into an uptrend usually improves your probability of making money after you figure out at what price to sell.
Preservation of Capital
Traders tend to make lesser mistakes and preserve capital buy not purchasing security when its prices are falling. In addition to this, you can also preserve capital by selling the security only when prices are in a downtrend.
Using Trend Filter in Forex
To understand how a trend filter works in the forex market, let us take an example.
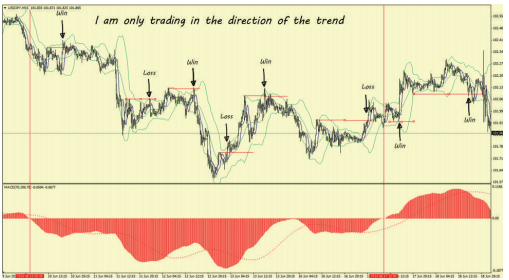
In the above chart, we have used MACD 70/200/70. In the example, a simple support and resistance trading system is operating, which sells on resistance in a downtrend and buys on support in an uptrend. The exit lies on the opposite support/resistance level. Each of the winning trades here has a risk/reward ratio of 3:1.
After trading the trend filter, there are 3 losses and 5 wins. The winning trades are 3 times bigger than the losing one, which returns 12 times the amount risked over 8 trades. You should remember that the above is just an idealized example. In normal scenarios, you can experience periods of whipsaws as the market consolidates before the formation of a new trend.
Some Useful Trend Filters in Forex
Displaced Moving Average
You can try a 25-period moving average which is displaced by 5 periods for short-term trends or on a higher timeframe in case of long-term trends. It is recommended to display moving averages for avoiding whipsaws experienced by the typical MA.
You can also try a 200*5 period MA on your entry timeframe. This is a variation of the 25*5 displaced moving average.
10-day Exponential Moving Average
Never trade against the 10 days EMA. If you use this, your entry should be on a lower timeframe.
12/26/9 MACD
These are the normal settings of MACD, which you can use on both your entry timeframe as well as on a higher one.
70/200/70 MACD
Always use this MACD on the main timeframe you use for trading.
Using Exponential Moving Average as Trend Filter
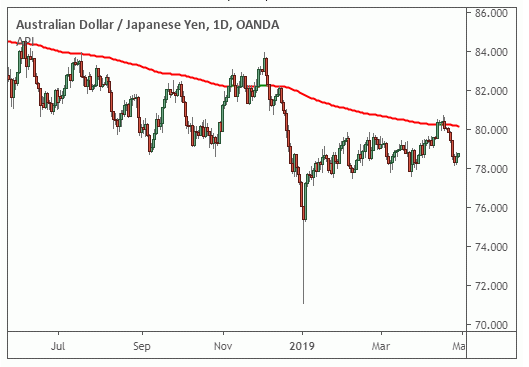
The above chart is an example of a 200-period Exponential Moving Average Trend Filter. In this case, you can find whether the overall trend is bearish or bullish by checking to see whether the daily candle price is above or below the 200-EMA. Here the AUD/JPY has experienced a period of chop from the start of 2019, making it harder for new traders to guess which direction the price is likely to move from here.
To get a clearer picture, place a 200 period EMA over the chart. If the daily price cannot close and hold above the 200 EMA, the chances are that the long-term trend will continue to the downside instead of reversing to the upside. Similarly, if the price gets back above the 200 EMA, holding above it for a considerable period of time, it’s an indication that the trend might move higher than lower.
The 200 EMA is helpful for novice traders to use as a bias filter for intraday and swing trades, while also being able to apply them in a number of rules-based trend following strategies. The majority of traders using this indicator as trend filters will only be searching for short setups on the AUD/JPY pair until the price crosses above the 200 EMA. This can also be applied to lower timeframes as well. Thus the 200 EMA can act as a powerful dynamic support and resistance zone and as an effective directional bias, no matter what the timeframe is.
However, you have to be aware that the longer the period of the MA used, the worse the lag is behind the most recent price action. It is thus very important to grasp this concept as it has the potential to both benefits as well as hurt your trading.
Final Thoughts
Trends can mean different things to different people with a variety of definitions possible. You can define the trend according to the technical measures that appeal to your trading logic and your style. Thus, the definitions of “trendedness” are spread out, depending on which one suits the particular trader’s personality and trading style.


