Traders are usually classified into two groups, i.e., fundamentals and technicals. Technical trading involves the use of reading the price action that forms on the chart. It considers the Fibonacci intervals, support and resistance, key levels, indicators, trend lines, and in some cases, harmonics.
Over time different trading strategies have been developed to provide better results in contrast with prior ones. By tweaking harmonics and combining it alongside other factors for confluence can help with the cause. Our article will cover how a trader can exploit harmonics in their trading through various trading strategies and discuss the potential drawbacks too.
What are harmonics?
The word may sound familiar to those with a little knowledge of science—the real meaning of harmonic suggests its similarity to a wave. However, in trading, it translates to repeating small or large price action patterns, which depicts a trend. Their working pattern is similar to Fibonacci numbers, following a specific sequence which is then broken down into ratios that predict market movements. Traders can use them to spot potential price reversal points when the market is at the brink of exhaustion.
Important harmonic patterns and their implementation
Over time tons of harmonics have been made available to traders, but only a few have worked. Let us go through a few top patterns and how a trader can capitalize on them after spotting one.
Gartley
Named after the famous trader Harold McKinley Gartley, the Gartley pattern is also called the 222. He included all the information in his book Profits in the Stock Market that states all the necessary key ratios for identification.
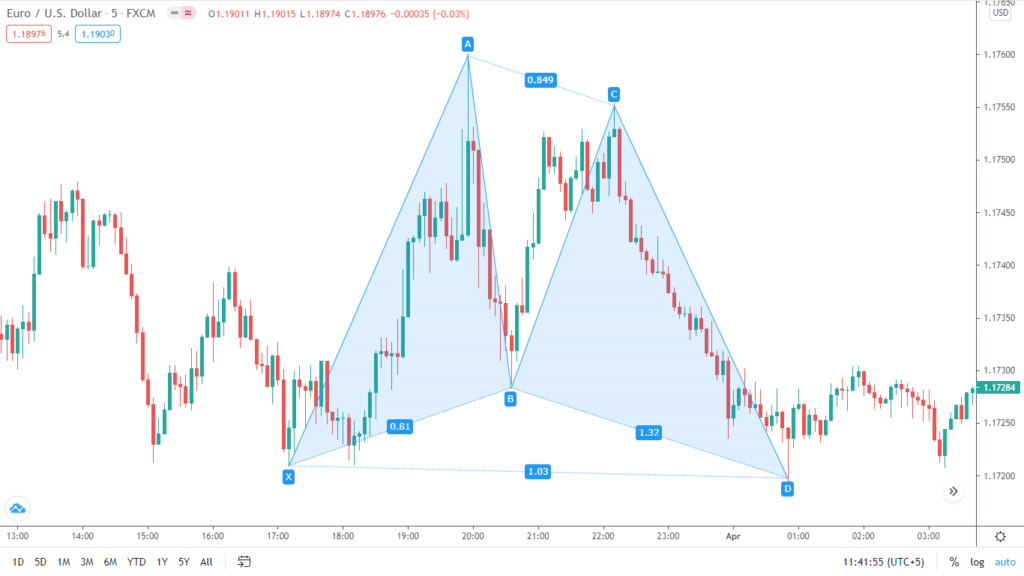
Image 1. A Gartley harmonic pattern. This is a bullish pattern which a trader can also plot in the reverse direction to get bearish trades. To draw it, you must satisfy some values that are available below.
| Point | Standard Value |
| X-D | 0.786 |
| A-C | 0.382 or 0.882 |
| B-D | 1.272 or 1.618 |
Remember that these values correspond to the Fibonacci ratios or intervals. Drawing them on the chart will let show exact retracements. The numbers don’t have to be precise, and there can be some ups and downs.
Crab
Discovered by Scott Carney in the year 2000, the Crab pattern was regarded as one of the high-risk/reward setups as the stop loss is tight. Similar to Gartley, a trader can use it for long or short setups.
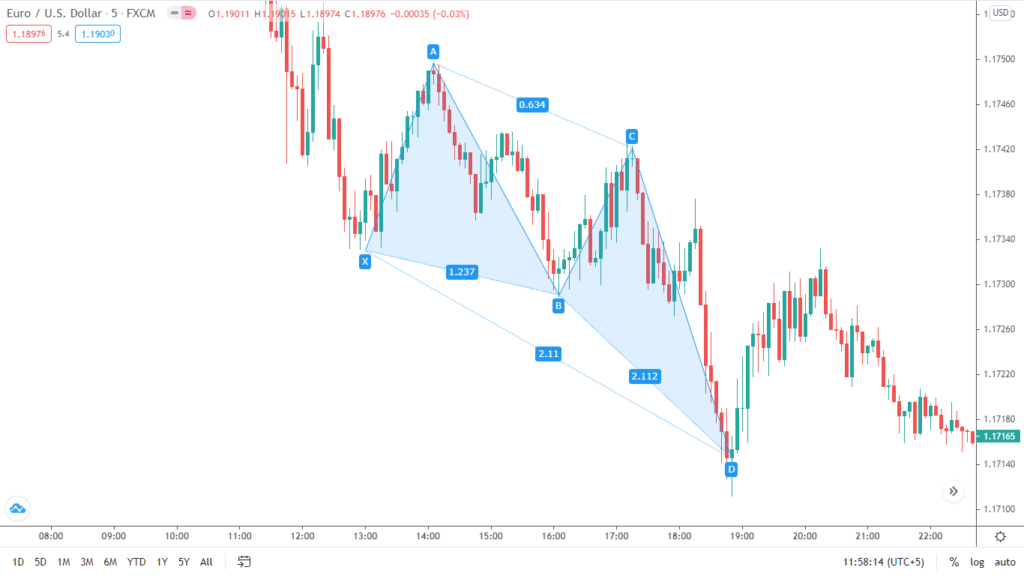
Image 2. A bullish crab pattern. You can place the stop loss just beneath point D and enter the long trade.
| Point | Standard Value |
| A-B | 0.382 or 0.618 |
| B-C | 0.382 or 0.886 |
| X-D | 1.618 |
Bat
Once you plot out this pattern on the chart, you will find a bat-like formation. It was also discovered by the harmonics master Scott in 2001.
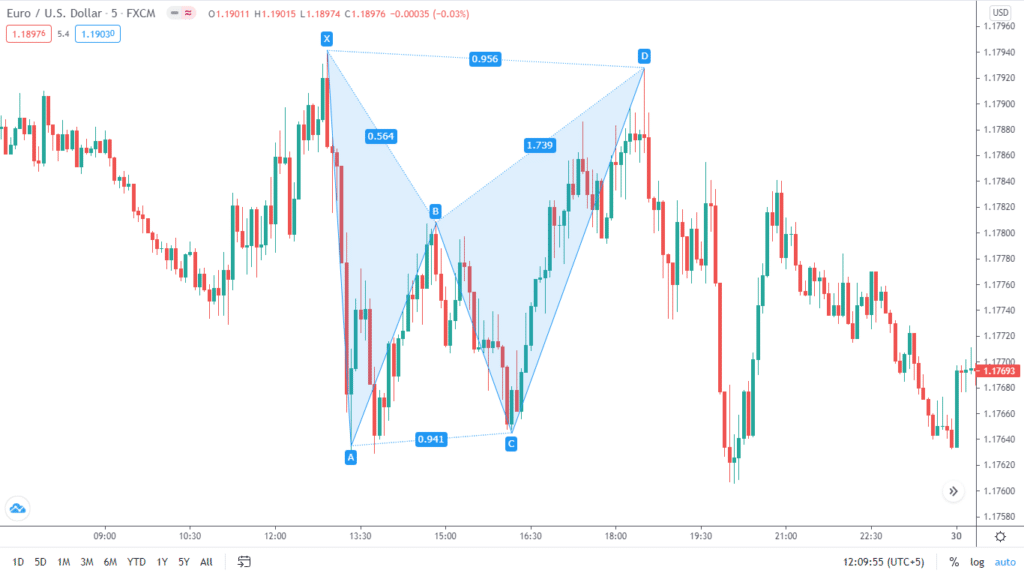
Image 3. A bearish crab pattern. You can place the stop loss just beneath point D and enter the long trade.
| Point | Standard Value |
| A-B | 0.382 or 0.500 |
| B-C | 0.382 or 0.886 |
| X-D | 0.886 |
Reversing these values, you can get a bullish crab pattern as well.
Butterfly
The butterfly pattern can seem similar to crab in the looks; however, the ratios are slightly different.
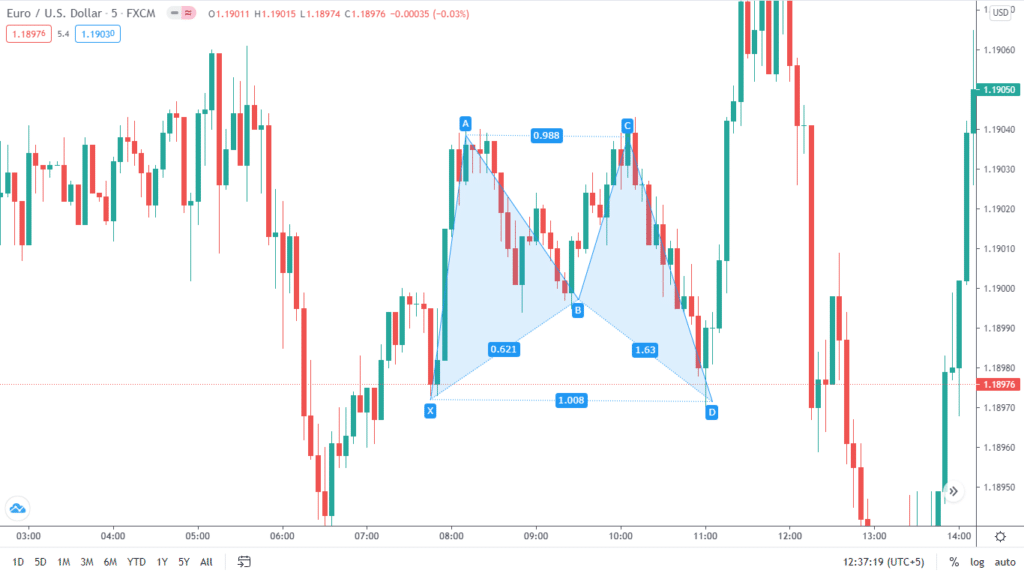
Image 4. Can you spot butterfly wings on the chart? This harmonic pattern looks identical to the insect’s rear wings. Place your stop loss just beneath point X.
| Point | Standard Value |
| A-B | 0.786 |
| B-C | 0.382 or 0.886 |
| X-D | 1.27 or 1.618 |
Using harmonics with other indicators
In price action or technical trading, big boys and top traders always recommend using several confirmations at once. This approach will lead to a higher chance of winning trades and improve your trading consistency. For example, in a particular instance where harmonics are screaming a buy on lower time frames, the market might be at a supply zone on the bigger picture. Before taking a trade in a specific direction, a trader can also confirm the momentum or trend. Other technical indicators such as moving averages, RSI, Stochastic are also available.
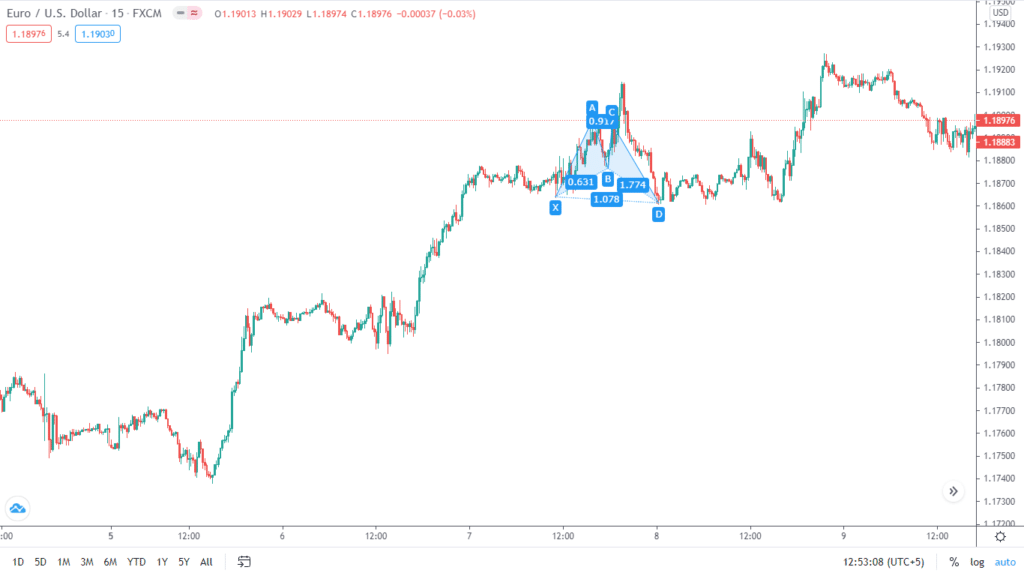
Image 5. The Gartley harmonic pattern that we previously identified. On the more extensive M15 chart, we can see that the current momentum and market trend are bullish. So when plotting harmonics, we usually look to enter on the long side.
For fundamental traders, they can use news events as catalysts to drive the markets and use harmonics to time their entries if they see a developing pattern.
Are there any drawbacks to harmonics?
Harmonics can offer accessible trading opportunities as a trader only has to satisfy a few ratios on the chart. But in the bigger picture, there are a few drawbacks that you must keep in mind to use them ideally.
- Pattern cluttering. It is easy to confuse different ratios with one another as they match closely. Without using specialized software, remembering all of these and plotting can be an arduous task.
- Contradiction. Scanning different time frames are only good when you are considering various indicators. Using harmonics in a similar way can give a buy on the lower and sell on a higher period.
- Stop losses. As your stop losses are sometimes extremely close to the entry point, there is a higher chance to hit it. Frequent failures may damage your psychology if you are starting in the financial markets.
End of the line
Harmonics are an excellent way to trade the markets once you understand the proper ways to utilize them. Any strategy that a trader uses must also apply appropriate risk management as there are times when it will work and times when it won’t. Keep your mindset on the positive end, and harmonics may reward you.


