ForexEzy
No Result
View All Result
  • Top Forex Advisors
    • Best Forex Robots
    • Best Forex Signals
    • Best Managed Accounts
  • Top Forex Brokers
    • Best Forex Brokers
    • US Forex Brokers
    • UK Forex Brokers
    • MT4 Forex Brokers
    • MT5 Forex Brokers
    • Zero Spread Brokers
    • Best PayPal Brokers
    • TradingView Brokers
    • Social Trading Platforms
  • Top Review Platforms
  • Forex Education
    • Getting Started
    • Forex Basics
    • Forex Trading Strategies
    • Money Management
    • Risk Management
    • Technical Analysis
    • Fundamental Analysis
    • Trading Psychology
    • Social Trading
    • Automated Trading
  • Forex Tools
    • Forex Robots
    • Forex Indicators
    • Forex Signals
    • Forex VPS
  • Forex Forecast
  • Crypto
    • Best Crypto Exchanges
    • Best Crypto Bots
    • Crypto Guides & Forecasts
No Result
View All Result
ForexEzy
No Result
View All Result
The World’s Leading Social Trading Platform
Try now
Home Cryptocurrency Trading

Best 14-RSI Strategies for Crypto Traders

by Adam Stanley
May 25, 2022
in Cryptocurrency Trading
0
Best 14-RSI Strategies for Crypto Traders
0
SHARES
11
VIEWS
Share on FacebookShare on Twitter

In crypto, technical analysts often benefit from trading recognizable candlestick patterns such as the head and shoulders, cup and handle, and double and triple tops, just to mention a few. However, this may bring some level of success; it’s always helpful to incorporate supplemental indicators. Of these, one of the most widely used is the Relative Strength Index or RSI short. This indicator is used to help point out when an asset’s price has strayed away from its true value, indicating an incumbent market correction. This helps crypto traders better time their trade entries in this highly volatile market. 

The Best Forex Robots Report Is Already Here!
best forex robots
Check out 30+ best expert advisors with daily updated live results and statistics
Click Here

About the RSI 

This is an indicator that shows the momentum and speed with which a crypto asset’s price moves. It is calculated by comparing the average upward price movement of a coin against the average downward price movement over time. It rates this on a scale of zero to one hundred. Extreme readings might indicate if a crypto asset is overbought or oversold. 

How is the RSI obtained? The formula for calculating it is shown below.

RSI = 100 – (100/1 + RS)

The RS is the relative strength obtained by dividing all bullish closes over the last n periods by the total bearish closes over the same period. 

By default, the number of periods used is 14. This means that for a daily chart, the RSI will be calculated for the last 14 days, while for a weekly chart, it covers the last 14 weeks. However, most charting platforms will allow you to tweak this number as you see fit.  

How it works

The overbought signal

Uptrends are caused by more and more people buying into a crypto asset, which raises its demand and, consequently, its price. However, as the price gets higher, some buyers who had bought earlier start taking their profits, and as more of them liquidate their positions, supply starts outweighing the demand. 

As an oscillator, the RSI tends to follow the direction of price movement. This means that during an uptrend, the indicator will trend upwards as well. When the rally starts losing momentum, the RSI will typically read above 70, indicating that the asset has been overbought. This usually signifies an incoming bearish reversal.

The RSI on a BTC hourly chart.

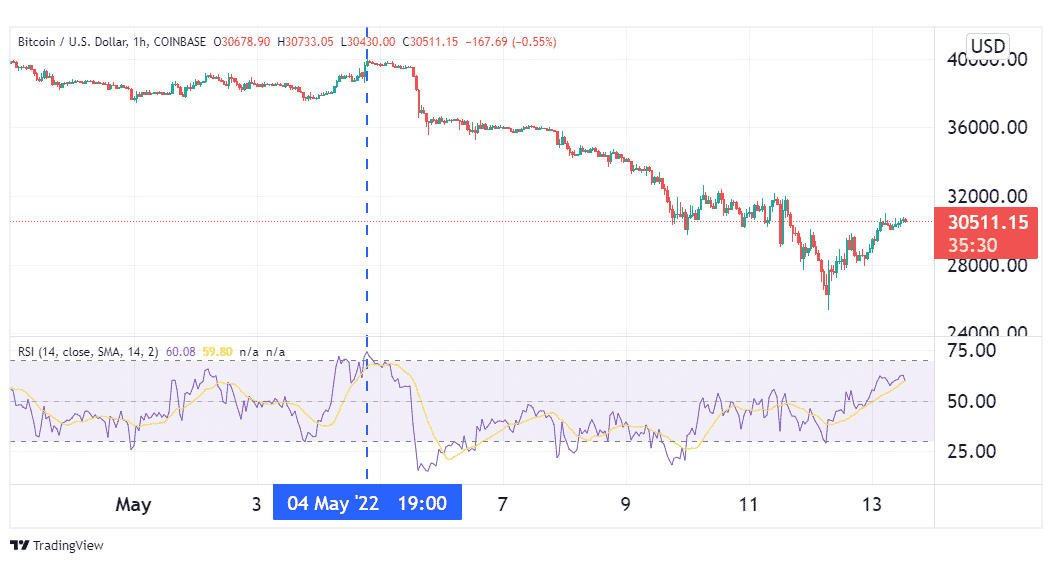
In the illustration above, we see the RSI marked BTC as overbought on 4th May. This was the signal for traders to go short on the asset. True to the signal, Bitcoin embarked on a downtrend shortly after.

The oversold signal

Similarly, during downtrends, the oscillator will typically plummet along with the price. When the RSI reads extreme values, usually below 30, it signifies that the trend’s momentum is waning. This is because the asset is oversold, and buying pressure is starting to overwhelm the bears. Usually, an oversold signal signifies an incoming bullish reversal. This is illustrated in the image below.   

The RSI on a BNB price chart.

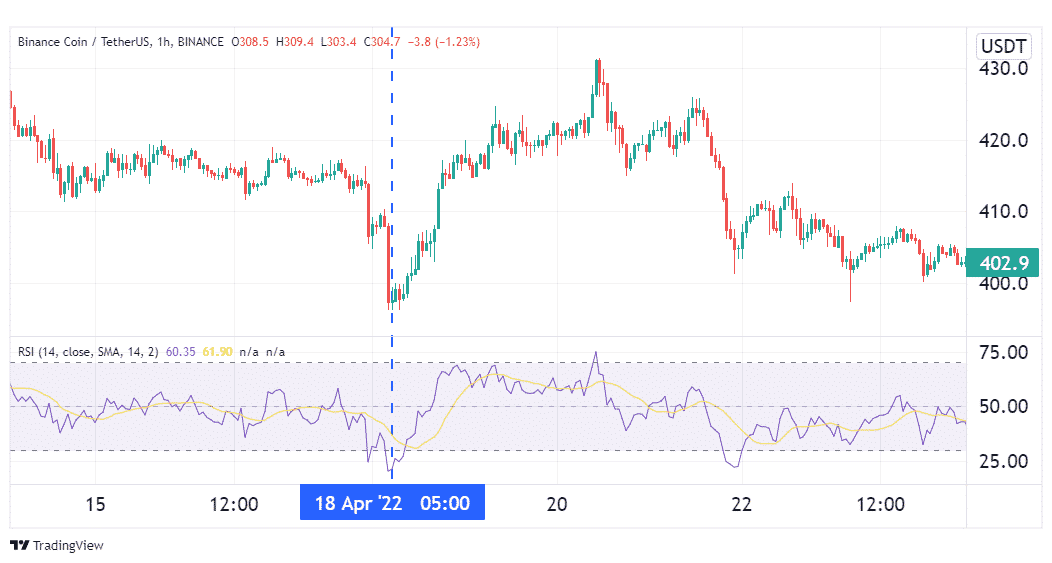
On 18th April, the RSI showed that Binance Coin was oversold, which is a bullish flag. True to this signal, the coin went on a sustained uptrend for the next few days. 

Unfortunately, the RSI is not very accurate when used as a standalone indicator. It is prone to false signals, especially when the market experiences unexpected volatility. For that reason, it is always prudent to use it with another complementary indicator for the purpose of signal confirmation. Let’s look at some of the popular indicators used in conjunction with the RSI.

RSI + MACD strategy

The Moving Average Convergence Divergence (MACD) is a tool used for determining the direction and velocity of a trend. A MACD line, a signal line, and a histogram make up the chart. A bullish flag is formed when the MACD line crosses above the signal while the histogram changes into positive territory. On the other hand, a bearish flag is formed when the MACD line passes below the signal, and the histogram becomes negative. These indications can be combined with RSI’s overbought and oversold signals, as seen below. 

Trading Bitcoin using the RSI + MACD strategy.

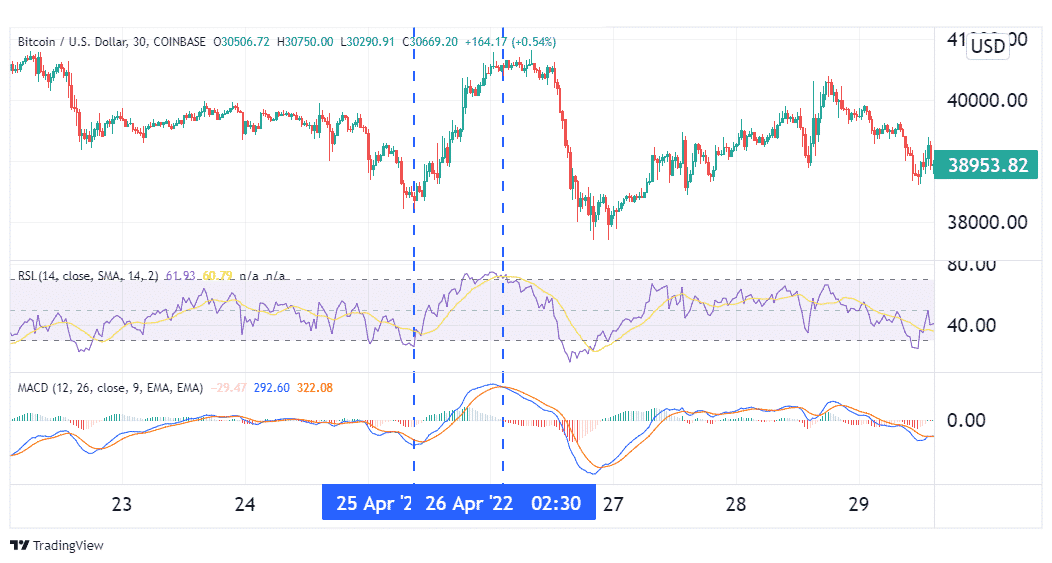
From the image above, RSI showed that Bitcoin was oversold on 25th April, a bullish flag. The signal was confirmed when shortly after, the blue MACD line crossed above the red signal line. This was the signal to buy the coin.

A day later, on the 26th, RSI gave the first bearish flag by going into overbought territory. Almost immediately, the MACD line crossed below the signal, confirming the bearish signal. This marked the exit of our long trade. 

RSI + Bollinger Bands strategy

Bollinger Bands are an indicator used to depict whether prices are trending up or down on a relative basis. It utilizes a middle band which is a Simple Moving Average of the price, and two outer bands above and below it, separated from this middle band by a measure of standard deviations. When prices cross above the SMA to trend against the upper band, the market is bullish. If they cross below it to adhere to the lower band, the asset’s price is in a downtrend. This indicator can be used with the RSI, as seen below.

The RSI + Bollinger Bands strategy on an ETH price chart.

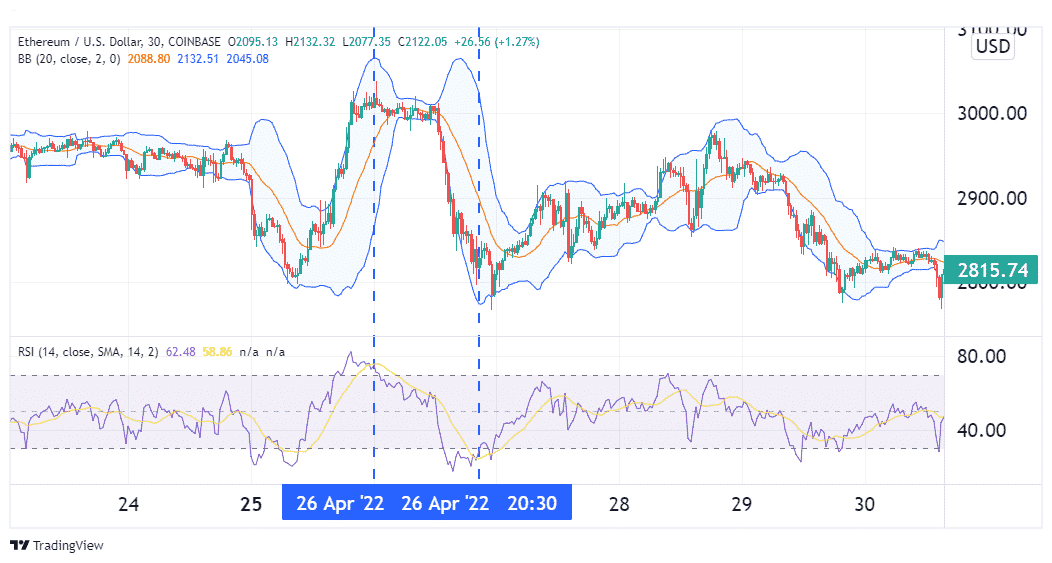
On 26th April, after a sustained rally, RSI indicated that Ethereum was overbought. This bearish signal was confirmed when shortly after, prices broke below the middle Bollinger Band to adhere to the lower. This marked the entry for a short trade. Later that day, RSI marked ETH as oversold. Shortly after, prices broke above the middle Bollinger Band, marking the exit for our short trade.

Conclusion

The RSI is a popular oscillator used in a variety of financial markets. In crypto, it can help identify whether an asset has been overbought or oversold, which can help traders better time their entries and exits. However, it is prone to false signals, which is why it is best to use it in combination with other indicators such as the MACD and Bollinger Bands.  

The Best Forex Robots Report Is Already Here!
best forex robots
Check out 30+ best expert advisors with daily updated live results and statistics
Click Here
ShareTweet
Previous Post

Trader Joe Decentralized Exchange Review

Next Post

Waiting Night Review

Related Posts

Shrimpy.io review

by Tim Baudin

It is advisable to use the Shrimpy.io platform to work with crypto assets. It allows you to put together all...

KuCoin review

by Tim Baudin

Trading on the stock exchanges is always full of surprises. Often they are unpleasant, so traders have to endure various...

Gemini review

by Tim Baudin

Operations with cryptocurrency are a modern direction of trading. For their safe and profitable conduct, you should use the services...

Solarbeam Decentralized Exchange Review

Solarbeam Decentralized Exchange Review

by Adam Stanley

Solarbeam background Solarbeam is a decentralized exchange that strives to give the cryptocurrency community a comprehensive and convenient one-stop platform....

TWAP Bot Review: Is It a Legit Crypto Bot?

TWAP Bot Review: Is It a Legit Crypto Bot?

by Chintan Patel

TWAP Bot applies one of the simplest trading strategies in the crypto market. The bot is one of the listed...

Load More

Leave a Reply Cancel reply

Your email address will not be published. Required fields are marked *

Best Forex Automated Systems

  • TechBerry 9/10
  • Happy Galaxy 8.5/10
  • Forex Cyborg 8.5/10
  • Forex Fury 8/10
  • FXgoodway 7.5/10
  • Best Forex Brokers
  • Best Forex Robots
  • Best Forex Signals
  • Best Forex Managed Accounts

Top Trading Markets

We are dedicated to demystify the world of forex trading for you – no matter what level you are on.

Categories
  • Automated Trading
  • Crypto Robot Review
  • Cryptocurrency Trading
  • Day Trading
  • Forex Basics
  • Forex Brokers
  • Forex Education
  • Forex Forecasts
  • Forex Indicators
  • Forex Market Commentary
  • Forex Robots
  • Forex Signals
  • Forex Signals
  • Forex Tools
  • Forex Trading Strategies
  • Forex VPS
  • Fundamental Analysis
  • Managed Accounts
  • Money Management
  • News
  • Review
  • Review Platforms
  • Risk Management
  • Social Trading
  • Technical Analysis
  • Top World Traders
  • Trading Apps
  • Trading Psychology
  • Uncategorized
Tags
Acquisition AI Amazon Apple Artificial Intelligence Bitcoin bond yields CEO China earnings earnings report economy Electric Vehicles Federal Reserve financial performance Financial Results forex ea forex software reviews Growth Guidance Housing Market inflation interest rates Investing investment Investors Market Volatility merger mortgage rates net profit Nvidia Oil prices Q2 Results revenue Revenue Growth Sales sales growth Stock Futures stock market stock performance Stocks strategies technology Tesla Video
  • Terms of Use
  • Privacy Policy
  • Compensation Disclosure
  • Risk Disclosure
  • About Us
  • Contact Us

Copyright © 2023 by ForexEzy.com

No Result
View All Result
  • Top Forex Advisors
    • Best Forex Robots
    • Best Forex Signals
    • Best Managed Accounts
  • Top Forex Brokers
    • Best Forex Brokers
    • US Forex Brokers
    • UK Forex Brokers
    • MT4 Forex Brokers
    • MT5 Forex Brokers
    • Zero Spread Brokers
    • Best PayPal Brokers
    • TradingView Brokers
    • Social Trading Platforms
  • Top Review Platforms
  • Forex Education
    • Getting Started
    • Forex Basics
    • Forex Trading Strategies
    • Money Management
    • Risk Management
    • Technical Analysis
    • Fundamental Analysis
    • Trading Psychology
    • Social Trading
    • Automated Trading
  • Forex Tools
    • Forex Robots
    • Forex Indicators
    • Forex Signals
    • Forex VPS
  • Forex Forecast
  • Crypto
    • Best Crypto Exchanges
    • Best Crypto Bots
    • Crypto Guides & Forecasts

© 2023, Forexezy. {copy} {year}