Overview
Are you still doubting the power of the RSI? This article will cover three recent forex trading opportunities mostly based on this technical indicator. As with any strategy, there always needs to be another confirmation rather than just trading off one signal.
Although there are several useful oscillators, the RSI is arguably one of the best-performing ones.
Why use the RSI?
One of the most important technical concepts in forex that any trader needs to master is momentum. The strategy of using this indicator doesn’t necessarily apply to the trend more than it does to momentum.
As a swing trader, you need to look at the long-term trend on the monthly, weekly, or daily time-frames with the hope of catching a sustained move. Observing the trend gets one on the preferred side of the market and forms a bias, but momentum reflects what is currently happening on a granular scale.
One of the best methods of using the RSI is looking for areas of little momentum after a pullback in a market with the dominant trend in mind.
Step-by-step tips using the RSI
Here are the tips for implementing a strategy using the RSI. Note that all the real chart examples to follow incorporate these steps logically.
- The first stage is observing the long-trend within the daily, weekly, or monthly time-frame. Using default settings, if the RSI peaks below the 30 line (known as the oversold area), we should only consider selling opportunities.
Conversely, if the RSI ‘peaks’ above the 70 line (known as the overbought area), we should only consider buying opportunities. This part is where we observe the long-term trend. After the trend identification, we would zoom into the 4HR and daily time-frames for the actual trading opportunities.
- Secondly, on the lower time-frames, we should observe when the RSI’ peaks’ below or above the 30 or 70 lines, respectively. In at least half the time, the market often breaks a new low or high to signal trend continuation, which is where the momentum aspect comes into play.
At other times, the market can instead come back into the area it previously ‘peaked,’ though rather than continuing the trend, it loses the momentum. This attribute is the one that traders should exploit with the RSI as this loss could signal a new imminent movement in line with the long-term trend.
- The last critical step is observing the momentum across multiple pairs. The slightest sign of momentum on one pair will almost certainly affect another. For example, if we’re looking at an opportunity on EUR/USD, at the time of entry, we’d have to look at the momentum for all EUR and USD major and minor pairs. This step is for extra confirmation.
Real chart examples
Patience is needed when swing trading as we should typically expect the market often takes a long time to reach new highs or lows in a big move.
When looking at the long-term trend, as a swing trader, we should aim to hold for about two weeks, preferably exiting after at least ten times our risk. Assuming the market does move this far and depending on the stop loss size, we may either reach this target or only have a small profit.
#1 CHF/JPY buy trade (20 November 2020)
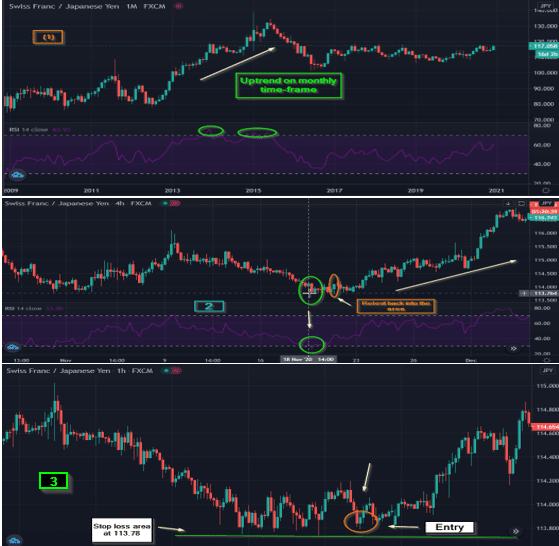
- The long-term trend on the monthly time-frame was bullish (image 1).
- 113.81 was the low on the 18th of November 2020, where there was a peak below the 30 line (signaling momentum). A few days later, the market came back into the area, albeit with little momentum (image 2).
- A safe entry is waiting for a 50%, 38.2%, or 23.6% Fibonacci retracement when the market enters that area. The entry would have been at 114.000 (image 3) with a stop loss at 113.780 (22 pips). As the trade goes favorably, moving the stop loss progressively towards the 38.2% level allows enough room for any wild pullbacks.
- Luckily, price did travel considerably (about 300 pips) from the point of entry. Presuming one exited the trade around the 117.000 area, the risk-to-reward would have been about 1:13.
#2 GBP/AUD sell trade (04 September 2020)
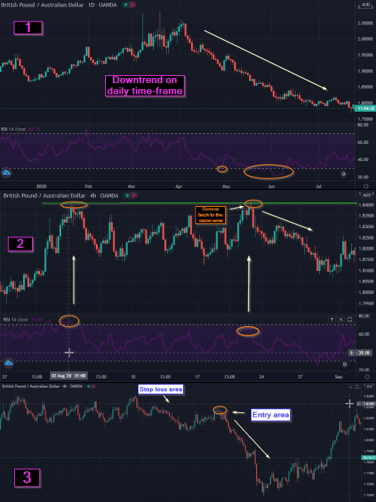
- The long-term trend on the daily time-frame was bearish (image 1).
- 1.8411 was the high on the 3rd of August 2020, where there was a peak above the 70 line (suggesting momentum). About three weeks later, it came back into the area, albeit with little momentum (image 2).
- A safer entry is waiting for a 50%, 38.2%, or 23.6% Fibonacci retracement when the market enters that area. This entry would have been around 1.82900 (image 3) with a stop loss at 1.83300 (40 pips).
As the trade traveled favorably, moving the stop loss progressively towards the 38.2% level allowing enough room for any wild pullbacks.
- Fortunately, the market did travel considerably (close to 800 pips) from the entry point. The risk-to-reward would have been about 1:20 assuming one exited at around the 1.7500 level. Such a move is quite rare, though GBP-pairs tend to be quite liquid.
#3 GBP/CHF sell trade (05 May 2020)
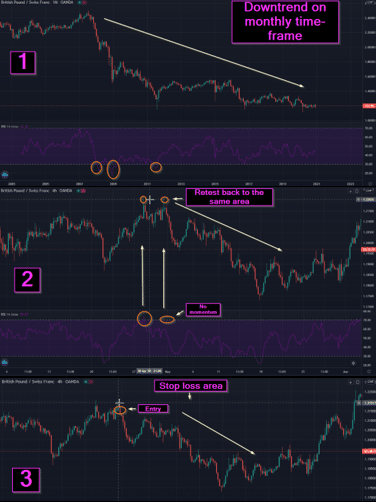
- The long-term trend on the monthly time-frame was bearish (image 1).
- 1.2206 was the high on the 28th of April 2020, where there was a peak above the 70 line (indicating momentum). A few days later, it came back into the area, albeit with little momentum (image 2).
- A safer entry is waiting for a 50%, 38.2%, or 23.6% Fibonacci retracement when the market enters that area. The entry would have been at 1.21600 (image 3) with a stop loss at 1.21900 (30 pips). As the trade moved in our favor, moving the stop loss progressively towards the 38.2% level allows enough room for any sudden pullbacks.
- Fortunately, the price went a significant 450 pips from the entry point, which is, again, expected for GBP pairs. The risk-to-reward would have been about 1:13, assuming one exited at around the 1.8000 area.
Conclusion
- For swing trading, you always first observe and trade in line with the dominant trend on a bigger time-frame while looking for the actual set-up and execution on at least the H4. Trading with this long-term bias gives us a better chance for a sustained move, further increasing our chance for a high risk-to-reward.
- The RSI is a brilliant oscillator at observing momentum where we look to exploit areas where it shifts, which is the main trick. When the market enters back into an optimal area, we should observe it across all the related pairs.
- Having strict entry rules may mean missing out on the occasional trade, though it does allow for optimal entries.
- Money and trade management applies to any indicator and is often the missing puzzle between a substantially profitable position and one that isn’t.


