There are several reasons why most traders fail to be profitable. Poor risk management, little knowledge of the asset they trade, lack of emotional control, and false reading of technical analysis are some causes.
One of the most common mistakes traders make is that they do not correctly use indicators. In addition, it can be overwhelming trying to select one of the many that we find on the internet.
Beginning traders usually start by learning the most popular indicators. We can name RSI, MACD, VWAP, among many others.
To be profitable with a strategy, we must adequately configure the indicator. Unfortunately, we have found that most people who teach how to use the Relative Strength Index (RSI) misinterpret it.
If we fail in the technical analysis, we will likely lose in the market and become stressed and frustrated.
For this reason, we will show you how to configure the RSI and execute operations to succeed in your trading. Likewise, if you are already using it, you can add this new strategy to your repertoire.
What is the Relative Strength Index indicator?
RSI is a momentum oscillator. It is available and customizable on most trading and analytical platforms, so it is highly unlikely you will ever have to calculate it manually.
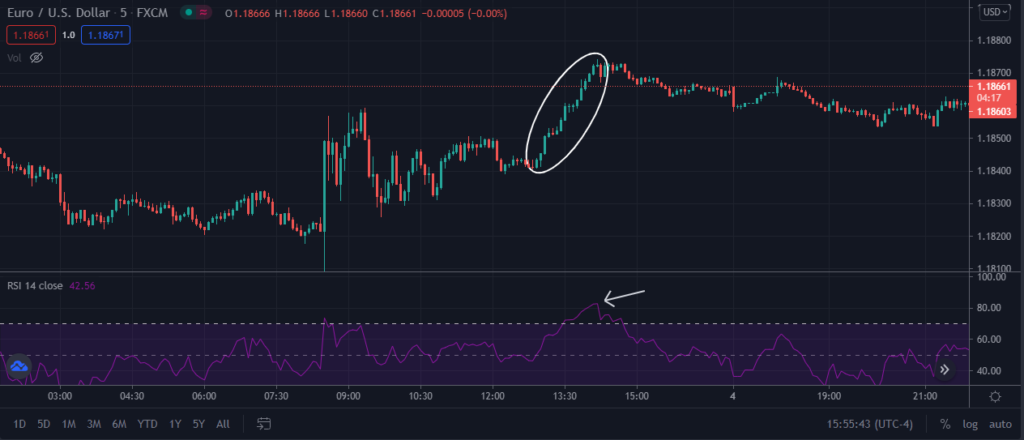
If in a 5-minute time frame, most of the last 15 candles you observe ended higher, the RSI should be near 100. The same would happen if the previous 15 candles closed lower; the number would be close to 0.
Why do people say RSI does not work?
Most of those who teach RSI strategies say that the asset is overbought when the RSI is greater than 80 and oversold if it is less than 20.
The best known traditional way is to sell when the RSI exceeds 80 and buy it below 20. Many traders will wait for the price to reach these levels to execute their operations.
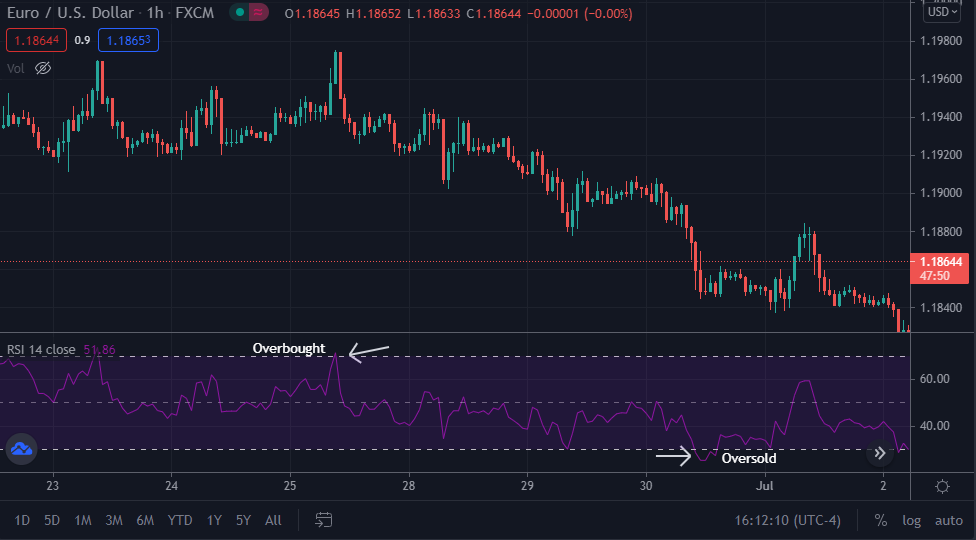
It is a mistake to look only at what the RSI indicates to decide a buy or sell because often, the price keeps going against us; let’s look at an example of the EURUSD pair.
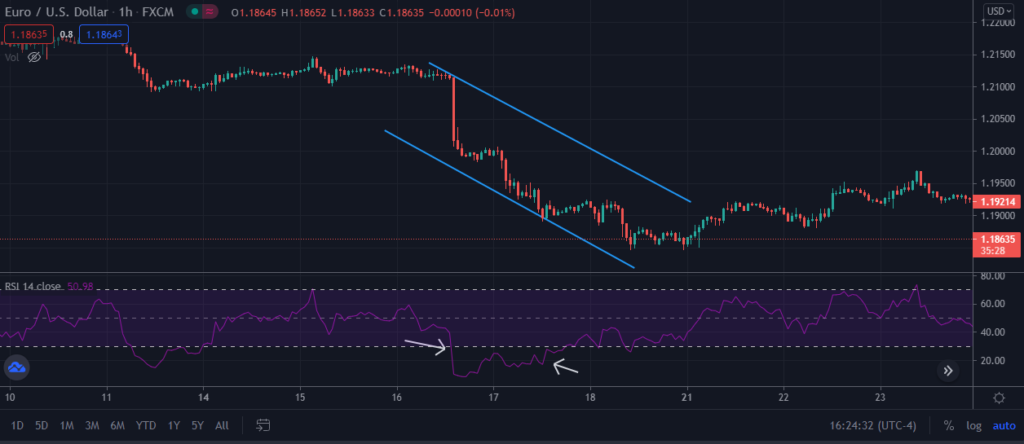
Although the price is well below oversold levels, it is not able to reverse immediately.
This wrong way of reading RSI occurs mainly in smaller time frames. In those cases, we will frequently see that price touches those levels and doesn’t manage to make a reversal.
How to use the RSI correctly?
We know that the RSI is a momentum indicator and does not work well predicting overbought and oversold levels. So, we will show you a simple but effective way to use it and get better odds of successful trades.
First, configure the indicator as follows:
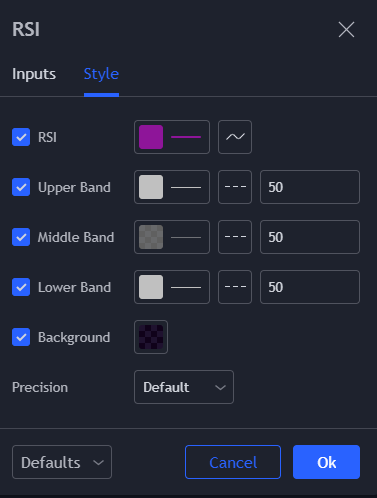
Next, we will change the way we use the indicator. Finally, we are going to combine the RSI analysis with the price action.
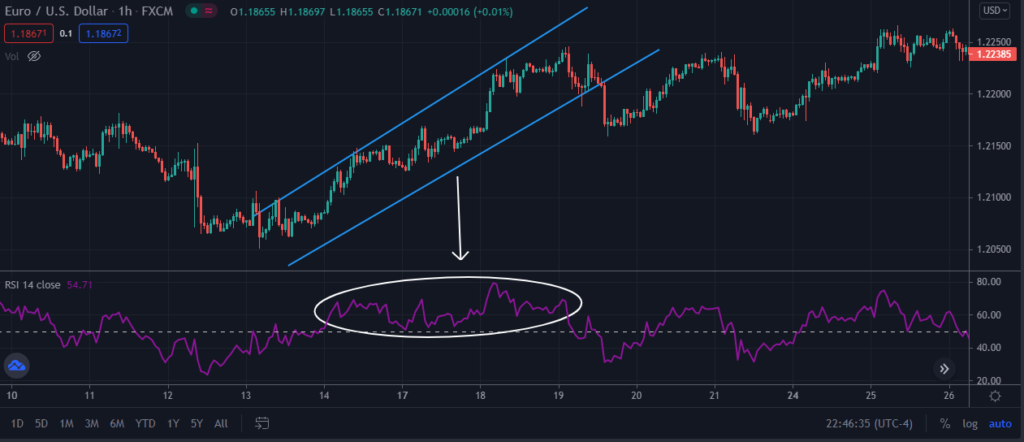
If the RSI remains above the 50 levels and the price makes new highs, this means bullish momentum. The opposite would be if the RSI is positioned below 50 and makes new lows, we would be in bearish momentum.
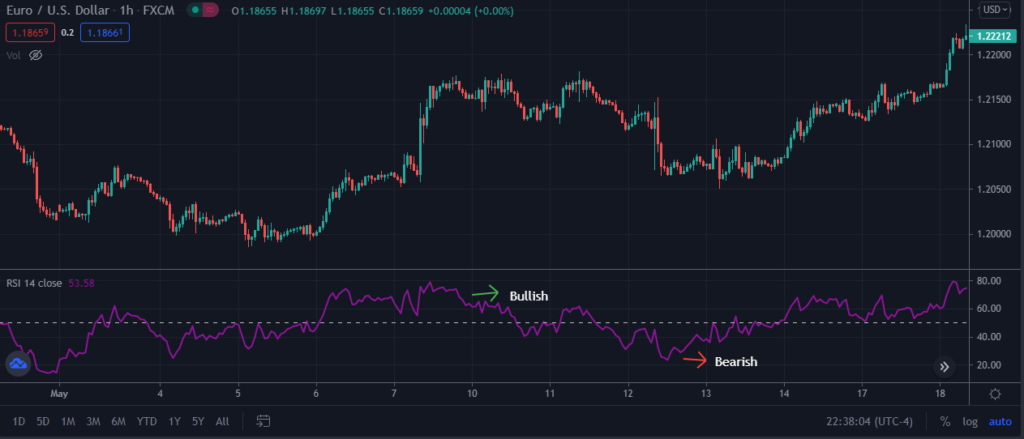
The chart below shows how the price is in an uptrend, and the RSI is above 50 levels.
Another profitable way to trade the RSI is by identifying divergences. The divergences between the price and RSI indicate a possible weakening of a trend. Thus, we can identify it when the price makes a new high, but the RSI makes a new low and vice versa.
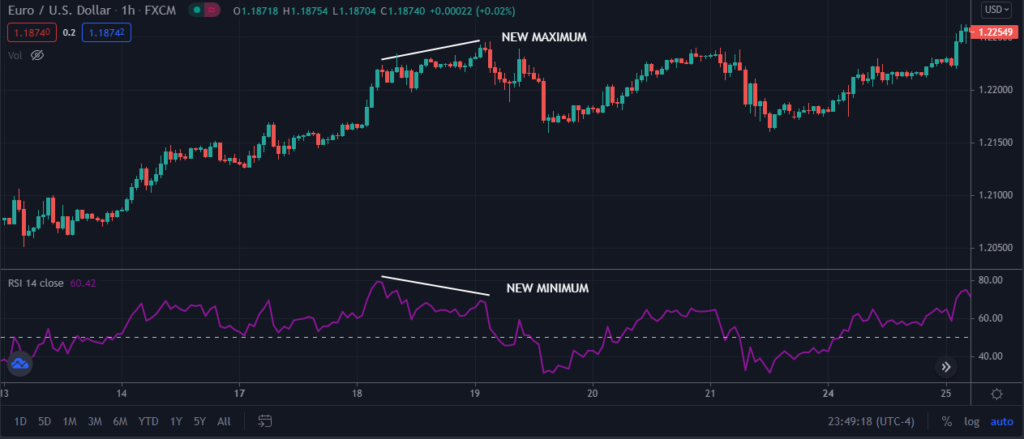
Once the divergence forms, the trend should end, and the price may reverse. Remember, we are talking about probabilities, so the reversal isn’t guaranteed.
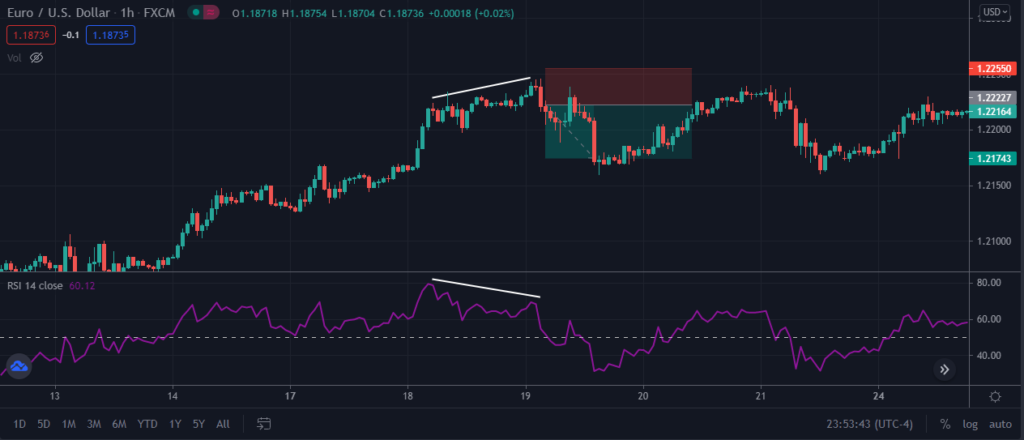
The steps to follow are simple:
- Select one of the recommended time frames.
- Identify the divergence.
- Execute the purchase or sale operation.
- Place your stop loss above the previous high if it is a sale and below the last low if it is a buy.
- Keep monitoring the position.
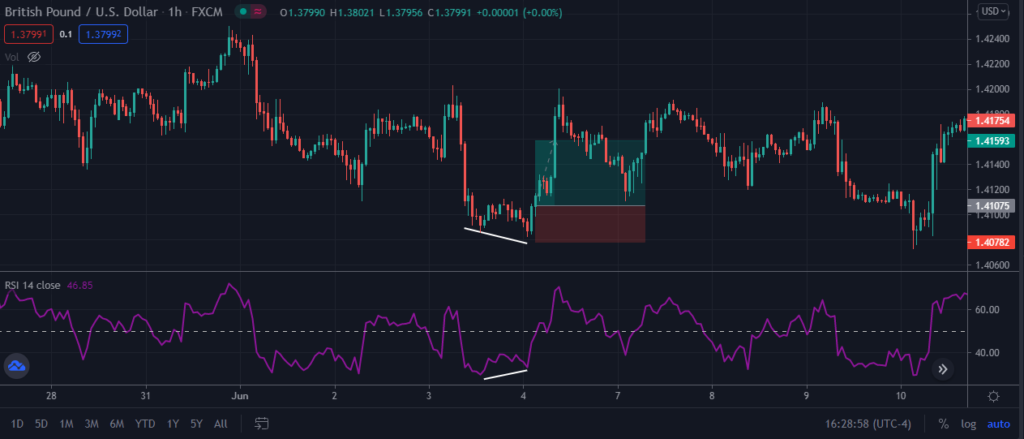
If you want to start trading with this strategy, it is best to use intraday time frames. Configure TradingView with 1-hour or 4-hour time frames.
Conclusion
It is always important to know how to configure the indicators of our strategy to achieve a specific objective.
It is not advisable to fill your chart with several indicators when you do not know how to use them effectively.
We must avoid the confusion that can lead us to execute operations with little probability of success. Remember that trading is based on probabilities.
If you are going to start applying the strategy we have taught you, make sure you set up TradingView with time frames of at least 4 hours, and then you can test with smaller time frames.
Be careful if you are going to scalp with this strategy. You can get more market entry signals, but the problem is that many of them will be false.
Finally, you can get your creativity out with this indicator and trade trends or even ranges.
Do not forget to use stop loss; cutting the losses will help you both in psychology and risk management.
Undoubtedly, this strategy will give you a better understanding of the market and consequently higher profits.
Make sure you test everything you have learned before using real money.


