ForexEzy
No Result
View All Result
  • Home
  • Getting Started with Forex
  • Forex Education
    • Forex Basics
    • Forex Trading Strategies
    • Money Management
    • Risk Management
    • Technical Analysis
    • Fundamental Analysis
    • Trading Psychology
    • Social Trading
    • Automated Trading
  • Forex Tools
    • Forex Robots
    • Forex Indicators
    • Forex Signals
  • Top Forex Brokers
  • Top Forex Robots
  • Commentary
  • Blog
No Result
View All Result
ForexEzy
No Result
View All Result
Home Forex Education Technical Analysis

Continuation Patterns – Triangles (Symmetrical, Ascending, and Descending)

by Tim Baudin
September 6, 2016
in Technical Analysis
0
Continuation Patterns - Triangles (Symmetrical, Ascending, and Descending)
0
SHARES
11
VIEWS
Share on FacebookShare on Twitter

Triangles formed by drawing two converging trend lines. Each trend lines consist at least two or more price points; thus, upper trend line requires, at least, two or more high points in price and lower trend line require at least two or more points in price.

There are three different types of triangles differentiated by the slope of their trend lines. These are,

  1. Symmetrical Triangle
  2. Ascending Triangle and
  3. Descending Triangle

Symmetrical Triangle:

In a symmetrical triangle, the upper trend line is downward sloping, and the lower trend line is upward sloping at the same angle. The joining or meeting point of these two trend lines called “Apex” and “Base” is the distance from the first high point and first low point.

This pattern is bullish in an uptrend as it shows the high possibility of the continuation of the prevailing uptrend. Inversely, in a downtrend, this pattern indicates a high possibility of continuation of the downtrend. The possible price movement can be measured by the height of the base.

Minimum price movement from the point of breakout is equaled to the height of the base.

In many cases, after a breakout price tends to come near the broken trend line and then bounce back to the prevailing trend again. This scenario is a pullback. Pullbacks are highly profitable.

Symmetrical-Triangle

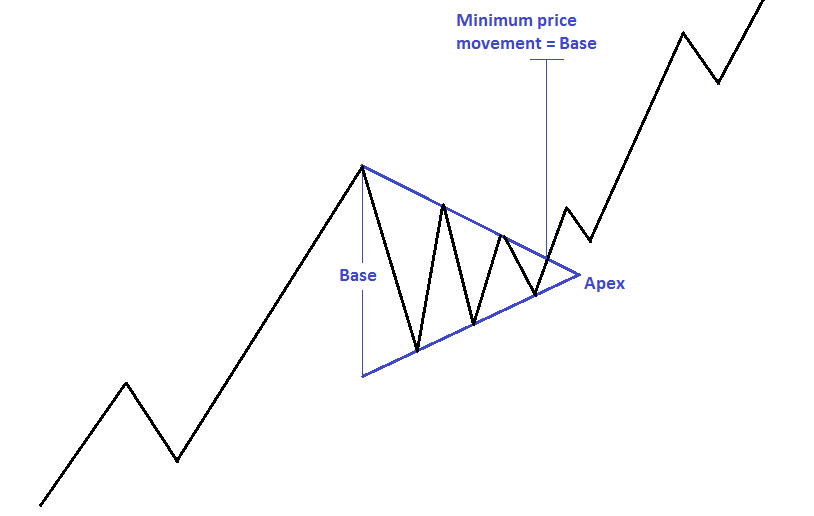
In the picture above, we can see the picture of a symmetrical triangle.

Now let’s take a look at the example in the technical chart of a currency pair.

Symmetrical-Triangle-Chart

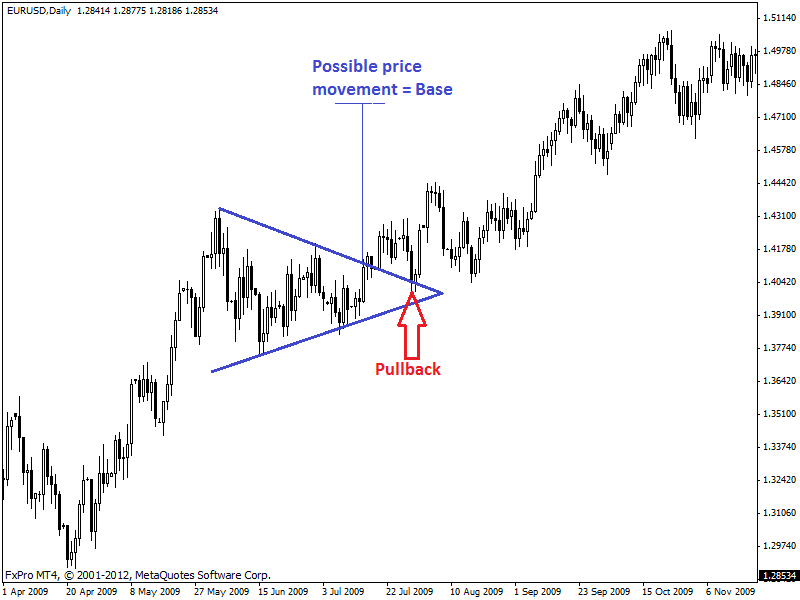
In the chart of daily EUR/USD given above, we can see an example of the symmetrical triangle and its pullback in an uptrend.

Ascending Triangle:

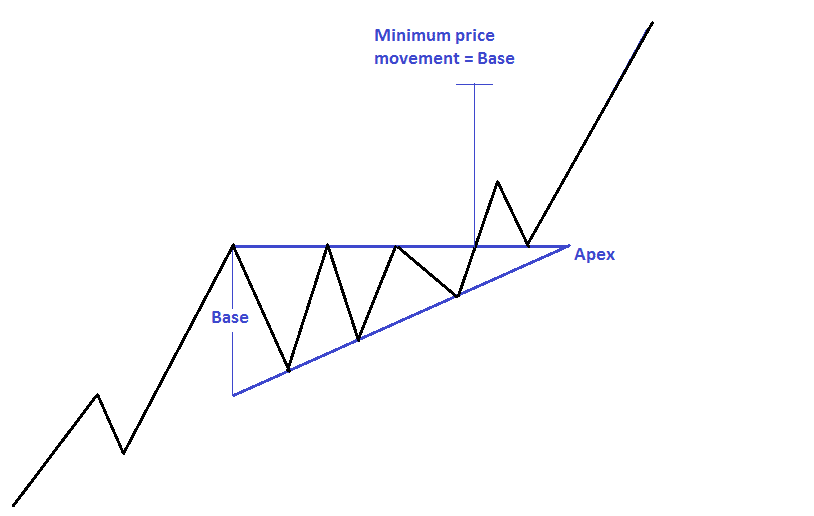
In ascending triangle, upper trend line should be horizontal (like horizontal resistance line), and lower trend line should be upward sloping. The horizontal upper trend line of this pattern indicates a resistance which is stopping the price from going further but the upward sloping lower trend line tells us about the presence of an uptrend.

Ascending triangle patterns are bullish patterns normally found in an uptrend. Like, symmetrical triangle, it has an apex point and a base and the minimum price movement equal to the height of base from the breakout point as shown in the picture below.

Ascending-Triangle

Breakouts and pullbacks of this pattern are particularly effective and profitable.

Now let’s see how this pattern looks like in a technical chart.

Ascending-Triangle-Chart

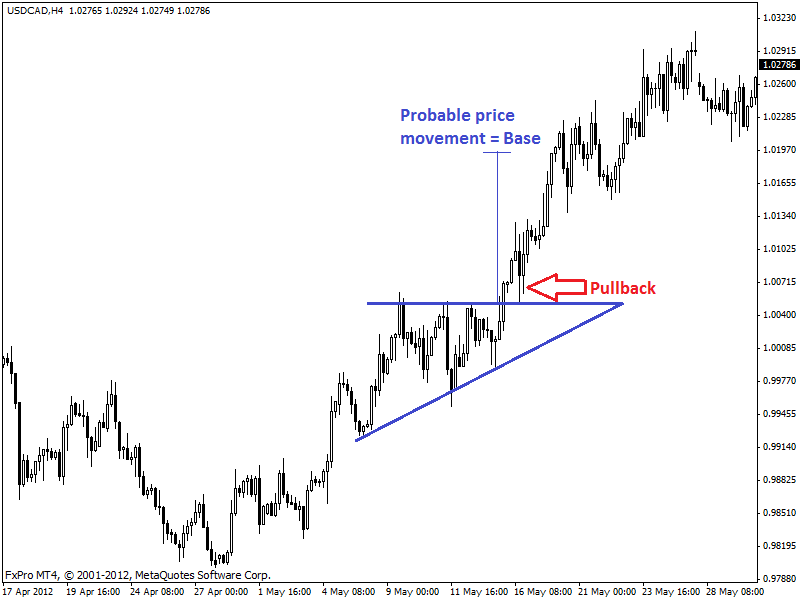
In the 4 hour chart of USD/CAD above, we can see an ascending triangle pattern, and it is a pullback.

Descending Triangle:

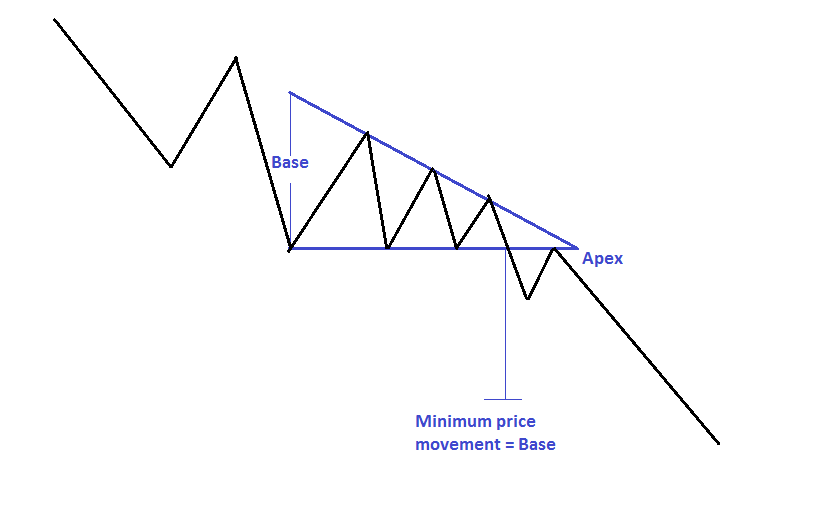
The descending triangle is opposite to the ascending triangle. In descending triangle, lower trend line should be horizontal (like horizontal resistance line) and upper trend line should be downward sloping. The horizontal lower trend line of this pattern indicates a support line.

This support line is stopping the price from going further down, but the upward sloping lower trend line tells us about the presence of a downtrend.

Descending triangle patterns are bearish patterns normally found in a downtrend. Like, symmetrical triangle, it has an apex point and a base and the minimum price movement equal to the height of base from the breakout point as shown in the picture below.

Descending-Triangle

Now let’s see how this pattern looks like in a technical chart.

Descending-Triangle-Chart

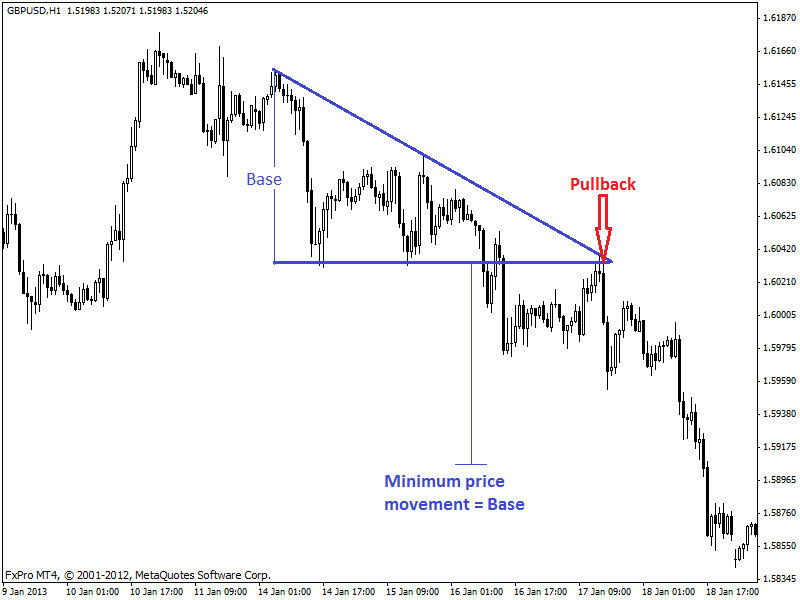
In 1 hour chart of USD/CAD above, we can see a descending triangle pattern and its pullback which pushed the price downward.

ShareTweet
Previous Post

Trading with Hook Reversal Pattern

Next Post

Continuation Patterns – Rectangles (Bullish and Bearish)

Related Posts

An Introduction To Forex Momentum Indicators

An Introduction To Forex Momentum Indicators

by Tim Baudin
January 19, 2021
0

Overview There is a recurring belief in trading communities that price lies, but momentum doesn’t. The forex market is somewhat...

An Introduction To Forex Indicators

An Introduction To Forex Indicators

by Chintan Patel
January 1, 2021
0

What are the Forex indicators? A vast part of technical analysis is understanding and trading with these tools. Although they...

Using Trendlines and Saucer Formations in Trading

Using Trendlines and Saucer Formations in Trading

by Tim Baudin
December 21, 2020
0

Trendlines are those lines that you can recognize easily. A trader draws trendlines on charts in order to connect a...

RSI - Top 3 Real Charts You've Missed

RSI – Top 3 Real Charts You’ve Missed

by Tim Baudin
December 17, 2020
0

Overview Are you still doubting the power of the RSI? This article will cover three recent forex trading opportunities mostly...

The Trading Indicator You Have not Heard of – The Williams %R

The Trading Indicator You Have not Heard of – The Williams %R

by Adam Stanley
December 1, 2020
0

The Williams Percentage Range is a highly effective tool that measures price variations over a period of time for various...

Load More

Best Forex EA

  • ROFX 9/10
  • Forex Fury 8/10
  • FXgoodway 7.5/10
  • Z Trader FX EA 7/10
  • Forex Incontrol Reborn 6.5/10

Popular News

  • The Best RSI and CCI Combination Trading Strategy for Optimum Returns

    The Best RSI and CCI Combination Trading Strategy for Optimum Returns

    2 shares
    Share 2 Tweet 0
  • Rofx Review – High Profitability and Stable Performance Analysis

    29 shares
    Share 29 Tweet 0
  • The Best Forex Scalping Strategy – Using 3 Popular Technical Indicators

    0 shares
    Share 0 Tweet 0
  • The Best MT4 Indicators & Expert Advisors For Forex Trading

    2 shares
    Share 2 Tweet 0
  • How to check if the indicator is repainting?

    2 shares
    Share 2 Tweet 0

Trading

Footer

We are dedicated to demystify the world of forex trading for you – no matter what level you are on.

Categories
  • Automated Trading
  • Day Trading
  • Forex Basics
  • Forex Brokers
  • Forex Education
  • Forex Forecasts
  • Forex Indicators
  • Forex Market Commentary
  • Forex Robots
  • Forex Signals
  • Forex Tools
  • Forex Trading Strategies
  • Fundamental Analysis
  • Money Management
  • News
  • Risk Management
  • Social Trading
  • Technical Analysis
  • Top World Traders
  • Trading Psychology
  • Uncategorized
Tags
arbitrage atr bollinger bands cci chart patterns classics copy trading courses day trading forex brokers forex charts forex ea forex education forex forecasting Forex Indicators forex software reviews grid trading hedging ichimoku macd market cycles news trading oscillators price action trading rsi social trading strategies tips & tricks trading bots trading platforms trend trading Video
  • Terms of Use
  • Privacy Policy
  • Compensation Disclosure
  • Risk Disclosure
  • About Us
  • Contact Us

Copyright © 2020 by ForexEzy.com

No Result
View All Result
  • Home
  • Getting Started with Forex
  • Forex Education
    • Forex Basics
    • Forex Trading Strategies
    • Money Management
    • Risk Management
    • Technical Analysis
    • Fundamental Analysis
    • Trading Psychology
    • Social Trading
    • Automated Trading
  • Forex Tools
    • Forex Robots
    • Forex Indicators
    • Forex Signals
  • Top Forex Brokers
  • Top Forex Robots
  • Commentary
  • Blog

© 2020, Forexezy.