ForexEzy
No Result
View All Result
  • Home
  • Forex Education
    • Forex Basics
    • Forex Trading Strategies
    • Money Management
    • Risk Management
    • Technical Analysis
    • Fundamental Analysis
    • Trading Psychology
    • Social Trading
    • Automated Trading
  • Forex Tools
    • Forex Robots
    • Forex Indicators
    • Forex Signals
  • Top Forex Brokers
  • Top Forex Robots
  • Commentary
  • Blog
No Result
View All Result
ForexEzy
No Result
View All Result
Home Forex Education Technical Analysis

Double Top and Double Bottom Reversal Patterns

by Tim Baudin
September 6, 2016
in Technical Analysis
0
Double Top and Double Bottom Reversal Patterns
0
SHARES
11
VIEWS
Share on FacebookShare on Twitter

Double top and double bottom are simple, profitable and classic chart patterns. They are reversal patterns.

Double Top Chart Pattern :

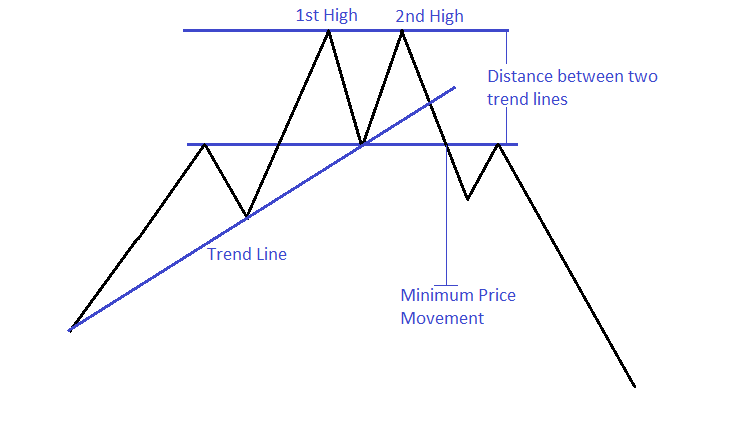
In a double top pattern; the upper trend line consists two similar or nearly similar high points and the lower trend line consist a low point. This low point of lower trend line lies between two high points that joined to draw the upper trend line.

This pattern often called “M-pattern” as it looks like English letter “M”.

Trend line breakouts, uptrend line breakout and pullbacks of this pattern are very effective sell signal which is an entry signal to take a short position. Minimum possible price movement after breakout equals to the distance between two horizontal trend lines. Here is an example.

Double-Top

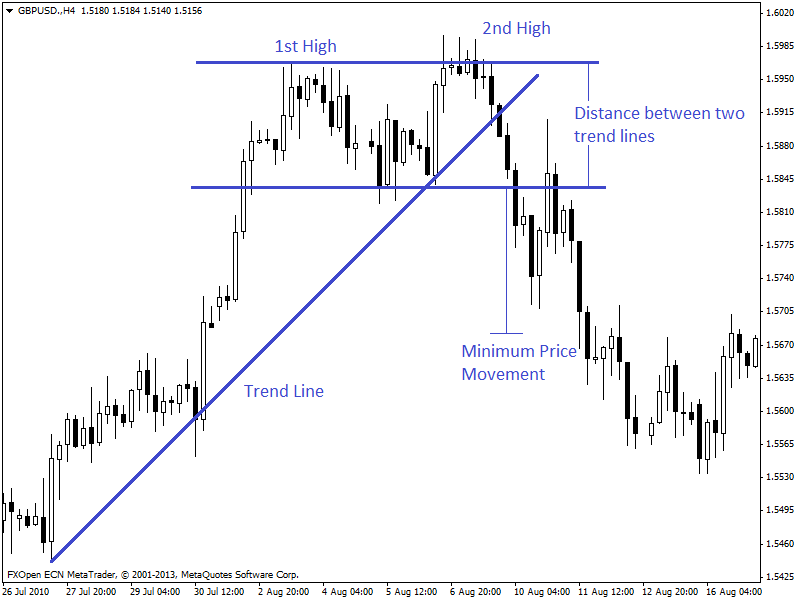
In the 4 hour chart of GBP/USD (given below), we can see a double top pattern has formed. As a double top pattern formed, it has broken the upward trend line first which is a sell signal. Then it is another sell signal as it moves below the trend line.

After this breakout price came back near the broken horizontal trend line (support line also). And then bounced back downtrend again which is a pullback and another profitable sell signal.

Double-Top-GBPUSD


Double Bottom Chart Pattern :

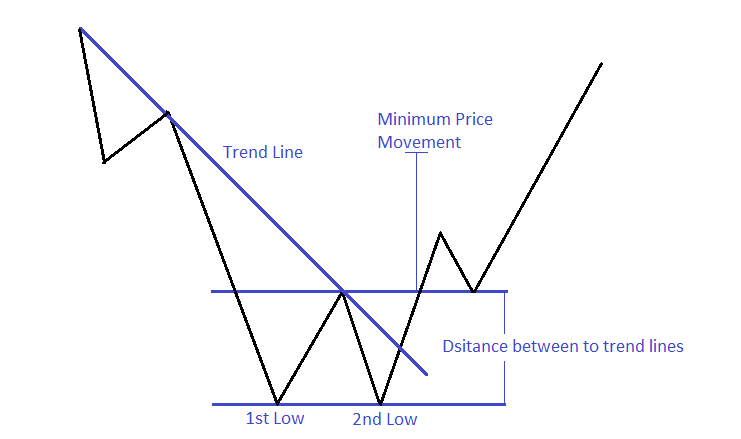
In double bottom chart pattern; the lower trend line consists two similar or nearly similar low points, and the upper trend line consists a high point. This high point of upper trend line lies between two low points. These two points joined together to draw a trend line. This pattern often called “W-pattern” as it looks like English letter “W”.

Trend line breakouts, uptrend line breakout, and pullbacks are very effective entry signal for a short position. Minimum possible price movement after breakout equals to the distance between two horizontal trend lines. Here is an example.

Double-Bottom


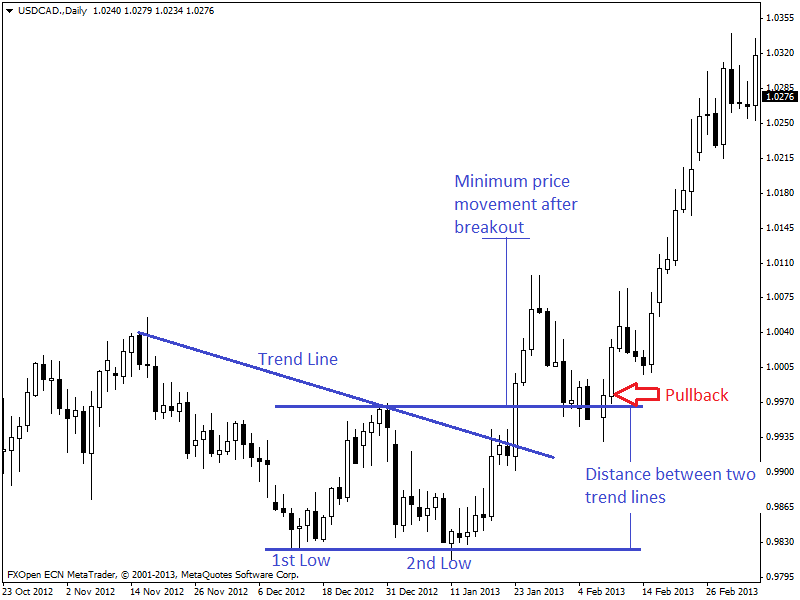
In the chart of daily USD/CAD (given below), we can see a double bottom pattern has formed. It has broken the downward trend line first which is a buy signal. Then it has broken the upper horizontal trend line (resistance line) which is a delayed but another buy signal.

Then price came back near the broken horizontal trend line (resistance line) and then bounced back to uptrend again; which is a pullback and another profitable buy signal.

Double-Bottom-USDCAD

ShareTweet
Previous Post

Reversal Patterns – Head and Shoulders Top and Bottom

Next Post

Trading with Hook Reversal Pattern

Related Posts

How to Trade Using Horn Bottoms in Bullish Markets

How to Trade Using Horn Bottoms in Bullish Markets

by Chintan Patel
April 16, 2021
0

Introduction Horn bottoms are down-trending spikes on trading charts. The pattern consists of two spikes that are visible on the...

An Introduction To Forex Momentum Indicators

An Introduction To Forex Momentum Indicators

by Tim Baudin
January 19, 2021
0

Overview There is a recurring belief in trading communities that price lies, but momentum doesn’t. The forex market is somewhat...

An Introduction To Forex Indicators

An Introduction To Forex Indicators

by Chintan Patel
January 1, 2021
0

What are the Forex indicators? A vast part of technical analysis is understanding and trading with these tools. Although they...

Using Trendlines and Saucer Formations in Trading

Using Trendlines and Saucer Formations in Trading

by Tim Baudin
December 21, 2020
0

Trendlines are those lines that you can recognize easily. A trader draws trendlines on charts in order to connect a...

RSI - Top 3 Real Charts You've Missed

RSI – Top 3 Real Charts You’ve Missed

by Tim Baudin
December 17, 2020
0

Overview Are you still doubting the power of the RSI? This article will cover three recent forex trading opportunities mostly...

Load More

Best Forex EA

  • ROFX 9/10
  • Forex Fury 8/10
  • FXgoodway 7.5/10
  • Z Trader FX EA 7/10
  • Forex Incontrol Reborn 6.5/10

Popular News

  • The Best RSI and CCI Combination Trading Strategy for Optimum Returns

    The Best RSI and CCI Combination Trading Strategy for Optimum Returns

    2 shares
    Share 2 Tweet 0
  • Rofx Review – High Profitability and Stable Performance Analysis

    29 shares
    Share 29 Tweet 0
  • The Best Forex Scalping Strategy – Using 3 Popular Technical Indicators

    0 shares
    Share 0 Tweet 0
  • The Best MT4 Indicators & Expert Advisors For Forex Trading

    2 shares
    Share 2 Tweet 0
  • How to check if the indicator is repainting?

    2 shares
    Share 2 Tweet 0

Trading

Footer

We are dedicated to demystify the world of forex trading for you – no matter what level you are on.

Categories
  • Automated Trading
  • Day Trading
  • Forex Basics
  • Forex Brokers
  • Forex Education
  • Forex Forecasts
  • Forex Indicators
  • Forex Market Commentary
  • Forex Robots
  • Forex Signals
  • Forex Tools
  • Forex Trading Strategies
  • Fundamental Analysis
  • Money Management
  • News
  • Risk Management
  • Social Trading
  • Technical Analysis
  • Top World Traders
  • Trading Psychology
  • Uncategorized
Tags
arbitrage atr bollinger bands cci chart patterns classics copy trading courses day trading forex brokers forex charts forex ea forex education forex forecasting Forex Indicators forex software reviews grid trading hedging ichimoku macd market cycles news trading oscillators price action trading rsi social trading strategies tips & tricks trading bots trading platforms trend trading Video
  • Terms of Use
  • Privacy Policy
  • Compensation Disclosure
  • Risk Disclosure
  • About Us
  • Contact Us

Copyright © 2021 by ForexEzy.com

No Result
View All Result
  • Home
  • Forex Education
    • Forex Basics
    • Forex Trading Strategies
    • Money Management
    • Risk Management
    • Technical Analysis
    • Fundamental Analysis
    • Trading Psychology
    • Social Trading
    • Automated Trading
  • Forex Tools
    • Forex Robots
    • Forex Indicators
    • Forex Signals
  • Top Forex Brokers
  • Top Forex Robots
  • Commentary
  • Blog

© 2021, Forexezy.