ForexEzy
No Result
View All Result
  • Home
  • Getting Started with Forex
  • Forex Education
    • Forex Basics
    • Forex Trading Strategies
    • Money Management
    • Risk Management
    • Technical Analysis
    • Fundamental Analysis
    • Trading Psychology
    • Social Trading
    • Automated Trading
  • Forex Tools
    • Forex Robots
    • Forex Indicators
    • Forex Signals
  • Top Forex Brokers
  • Top Forex Robots
  • Commentary
  • Blog
No Result
View All Result
ForexEzy
No Result
View All Result
Home Forex Education Forex Trading Strategies

Here Is What You Need To Know About Fibonacci Trading Strategy

by Adam Stanley
February 4, 2020
in Forex Trading Strategies
0
here is what you need to know about fibonacci trading strategy
2
SHARES
11
VIEWS
Share on FacebookShare on Twitter

A few things about forex trading are as scary as Fibonacci. Even the sound of the name itself gives you chills, but it should not be that way. The concept of Fibonacci is identifiable everywhere, from nature to architecture and art. Drawn from the divine ratio, otherwise called Phi, Fibonacci is simply a mathematical derivation of the ratio. 

In forex trading, traders and forex expert advisors alike rely on technical analysis to find the most opportune moments to enter or to exit a trade position. Technical analysis entails studying past price movements to determine possible future movements. Further, technical analysis is a technique that traders use to test trading strategies. Mainly, technical analysis provides critical insights about what one can expect if one followed a specific price pattern.

Understanding the Fibonacci indicator

Fibonacci is one of the best forex indicators for automated trading, as well as manual trading. The usage of the indicator is based on the mathematical theory behind the Fibonacci levels. The mathematical theory is the brainchild of Leonardo Fibonacci, an Italian mathematician, and an enthusiast of the Golden Ratio. This ratio is 1.618 or 0.618, depending on the direction you look at it, where 0.618 is the inverse of 1.618. The ratio is divine or golden because it is identifiable in nature, art, architecture, and many other places. Greeks call the ratio Phi.

Interestingly, Fibonacci manifested the divine ratio using a series of numbers, where a number is the sum of two preceding numbers. This series can go on to infinity. For example; 0,1,1,2,3,5,8,13,21,34,55,… Curiously, 3 is the sum of 2 and 1, 5 is the sum of 2 and 3, and so on. Further, dividing 5 by 3 gives 1.6667, dividing 8 by 5 gives 1.6 and so on. It goes on until the ratio comes closer to 1.618.

The Fibonacci lines (tools for Fibonacci trading strategy)

Traders and FX expert advisors use the ratio to derive what they call the Fibonacci lines. Usually, these lines represent certain percentages that traders use to identify entry and exit points during trading. The lines form a grid that starts from level 0 to level 100. However, the levels could be extended past the 100 level. 

Mainly, traders focus on the price levels that lie within the Fibonacci lines. This way, the traders can identify possible signs of a trend reversal when they study the candles within the 0 to 100 grid. For candles beyond the 100 level, it indicates that the trend will continue.

The Fibonacci lines are crucial in what traders call Fibonacci retracement. Fibonacci retracement is one of the best forex charting tools relied upon by traders to set up trading strategies. This technique helps massively during technical analysis. Usually, the level 0 of the Fibonacci grid lies on the extreme downside of a price chart while the level 100 rests on the extreme upside of the price chart. Then, special lines, each representing a certain ratio derived from the Fibonacci series, divide the space between 0 and 100. Each ratio is expressed as a percentage.

fibonacci trading strategy

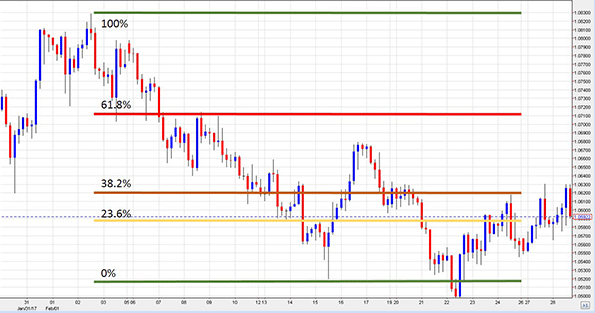
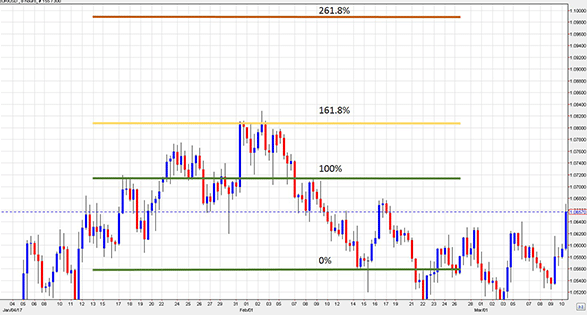
These lines are crucial towards the identification of possible resistance and support levels on the price chart. However, sometimes the market might swing past the 100% line. Here,you need to extend the Fibonacci lines past the 100 level. 

fibonacci lines on chart

Fibonacci trading strategy

Having understood the Fibonacci concept, it is time to put the tools to work. The most simplified Fibonacci trading strategy is one where you focus on trends and retracement levels. Usually, the retracement lines establish essential support and resistance levels. These levels are critical towards helping you to know when the best time to enter a trading position is. In automated trading, you can configure the system to watch out for retracements that signal a momentary pullback. Once the price pulls back and encounters resistance or support, you can now enter the trade.

fibonacci trading strategy

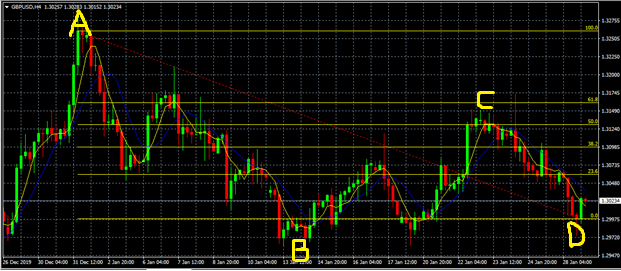
In the image above, we have drawn the Fibonacci retracement lines over a GBPUSD price chart ranging from 26 December 2019 to 29 January 2020. 

The GBPUSD four hour chart above shows that a downtrend started on 31 December 2019 at point A. This downtrend continued until the price bottomed out at point B on 13 January 2020. Then, the price attempted a retracement only fall back to a Fibonacci retracement level 0. However, the price picked up some positive momentum and climbed a little past 50.0% Fibonacci retracement level at Point C on 22 January. After that, the price tumbled steadily to point D on 28 January 2020.

From the Fibonacci trading strategy presented in the price chart above, you had the opportunity to short the GBPUSD at point C because of the resistance level at 61.8% Fibonacci retracement level. However, Fibonacci retracement alone is not enough to enable you to identify the right trading opportunity. That is why in the chart above, we have added a 5-period simple moving average (yellow line) and a 10-period simple moving average (blue line). Whenever these two cross, they signify a possible trend reversal. As you can see at Point C, the two lines crossed. 

Share2Tweet
Previous Post

Forex trading platforms that support Expert Advisors

Next Post

Types of Forex Breakout Trading Strategies That Work

Related Posts

ADX+RSI: The Unbeatable Forex Trading Strategy

ADX+RSI: The Unbeatable Forex Trading Strategy

by Chintan Patel
January 18, 2021
0

In order to pile up profits in the Forex market, you should choose a strategy that is backed by statistics....

An Introduction To Forex Trend Indicators

An Introduction To Forex Trend Indicators

by Adam Stanley
January 13, 2021
0

The trend is your friend’ is an old and popular expression in the financial markets. Consistently identifying the trend is...

Using Band Trading Strategy for Profits

Using Band Trading Strategy for Profits

by Adam Stanley
November 5, 2020
0

What is band trading? Do markets trend about 15 % of the time only?  So, what to do during the...

4 Forex Strategies Based on Trading Style

4 Forex Strategies Based on Trading Style

by Richard Brase
October 7, 2020
0

The foreign exchange market is the largest financial market in the world, where many have amassed fortunes just by playing...

5 Moving Averages Trading Strategies to Profit from the Markets

5 Moving Averages Trading Strategies to Profit from the Markets

by Adam Stanley
June 11, 2020
0

The name “Moving Averages” is self-explanatory and refers to the average ”moving” with each price period. Among the multiple moving...

Load More

Leave a Reply Cancel reply

Your email address will not be published. Required fields are marked *

Best Forex EA

  • ROFX 9/10
  • Forex Fury 8/10
  • FXgoodway 7.5/10
  • Z Trader FX EA 7/10
  • Forex Incontrol Reborn 6.5/10

Popular News

  • The Best RSI and CCI Combination Trading Strategy for Optimum Returns

    The Best RSI and CCI Combination Trading Strategy for Optimum Returns

    2 shares
    Share 2 Tweet 0
  • Rofx Review – High Profitability and Stable Performance Analysis

    29 shares
    Share 29 Tweet 0
  • The Best Forex Scalping Strategy – Using 3 Popular Technical Indicators

    0 shares
    Share 0 Tweet 0
  • The Best MT4 Indicators & Expert Advisors For Forex Trading

    2 shares
    Share 2 Tweet 0
  • How to check if the indicator is repainting?

    2 shares
    Share 2 Tweet 0

Trading

Footer

We are dedicated to demystify the world of forex trading for you – no matter what level you are on.

Categories
  • Automated Trading
  • Day Trading
  • Forex Basics
  • Forex Brokers
  • Forex Education
  • Forex Forecasts
  • Forex Indicators
  • Forex Market Commentary
  • Forex Robots
  • Forex Signals
  • Forex Tools
  • Forex Trading Strategies
  • Fundamental Analysis
  • Money Management
  • News
  • Risk Management
  • Social Trading
  • Technical Analysis
  • Top World Traders
  • Trading Psychology
  • Uncategorized
Tags
arbitrage atr bollinger bands cci chart patterns classics copy trading courses day trading forex brokers forex charts forex ea forex education forex forecasting Forex Indicators forex software reviews grid trading hedging ichimoku macd market cycles news trading oscillators price action trading rsi social trading strategies tips & tricks trading bots trading platforms trend trading Video
  • Terms of Use
  • Privacy Policy
  • Compensation Disclosure
  • Risk Disclosure
  • About Us
  • Contact Us

Copyright © 2020 by ForexEzy.com

No Result
View All Result
  • Home
  • Getting Started with Forex
  • Forex Education
    • Forex Basics
    • Forex Trading Strategies
    • Money Management
    • Risk Management
    • Technical Analysis
    • Fundamental Analysis
    • Trading Psychology
    • Social Trading
    • Automated Trading
  • Forex Tools
    • Forex Robots
    • Forex Indicators
    • Forex Signals
  • Top Forex Brokers
  • Top Forex Robots
  • Commentary
  • Blog

© 2020, Forexezy.