Nowadays, we hear a lot about the similarities of the stock market with the dot.com bubble. The stuff like “it’s too high,” “it’s growing too fast,” or “Central banks keep printing money,” and “new openings of retail brokerage accounts go parabolic” can invite little bias into our thinking.
Even if the crash is coming, I encourage you to stick to the evidence, whatever opinions are swirling in the air.
DXY: Bears are taking a short break
All those crazy short-term trend followers had a chance to stop and reflect last week, as the Dollar has been digesting losses. As we broke down the significant support around 92.00, I don’t think there should be any question about the direction of the trend in DXY.
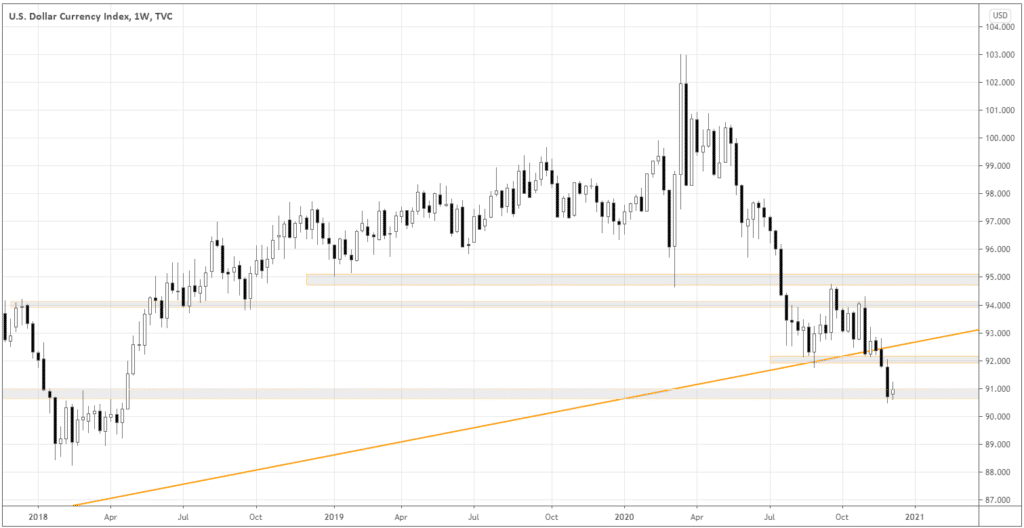
The bearish trend continuation of DXY signals and resuming money flow into the risk assets – that means we want to be buying the risk currencies against the US Dollar or Japanese yen and also own equities or basic commodities.
Intermarket evidence to buy risk assets
The classic indicator of the state of the economy is the bond market. In the chart below, you can see the ratio of 10-year treasury bills versus the S&P 500. What does it tell us?
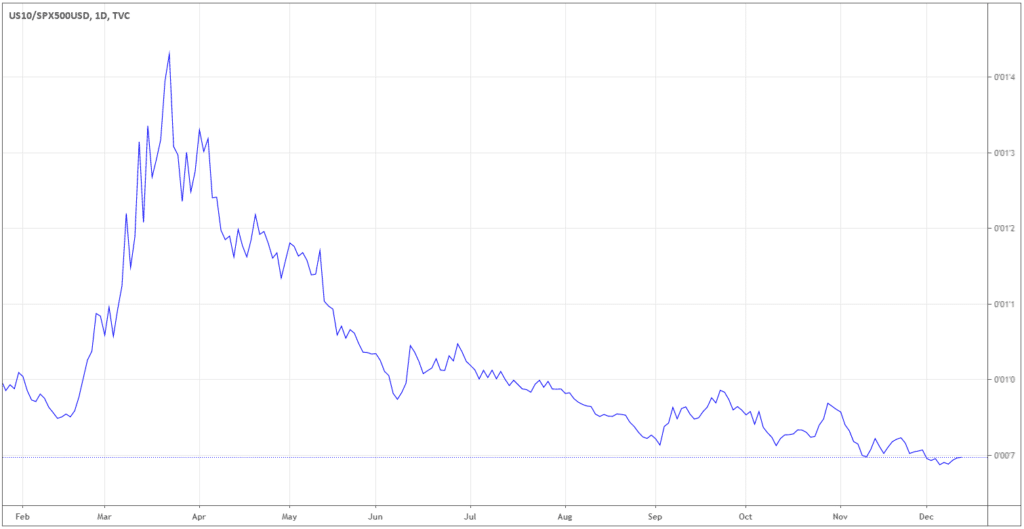
When the economy is doing well, investors expect higher returns from stocks than from bonds. Hence, they sell the latter. In the chart above, we can see that bonds make new lows relative to stocks.
Another important indicator of the economy’s health is how Staples perform versus the broad market. During the economic downturn, investors prefer buying Staples due to more consistent dividends.
Below is the ratio of XLP (Staples ETF) versus SPY (S&P 500 ETF).
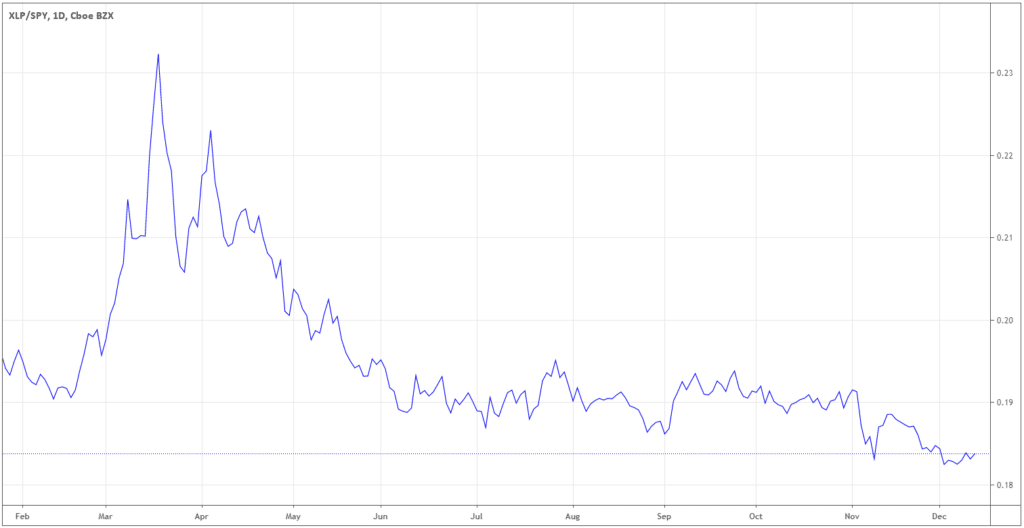
Staples made the new low in December, hinting that investors prefer to buy riskier stocks with more significant growth and earning potential.
When the risk sentiment shifts into defensive mode, investors traditionally prefer buying gold in an attempt to preserve the value of their liquid assets. Below is the chart of the Gold versus S&P 500 ratio.
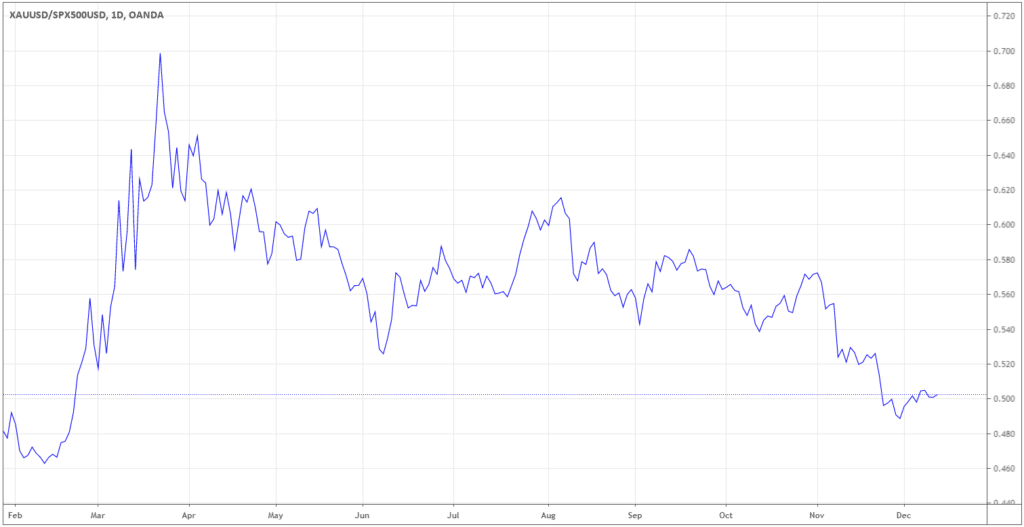
It’s a similar story here. Gold made a new low against the stock index at the end of November, suggesting there is not much fear among investors.
The last ratio that represents the risk sentiment is the currency pair AUD/JPY. AUD is a leading risk currency, and JPY is a safe-haven.
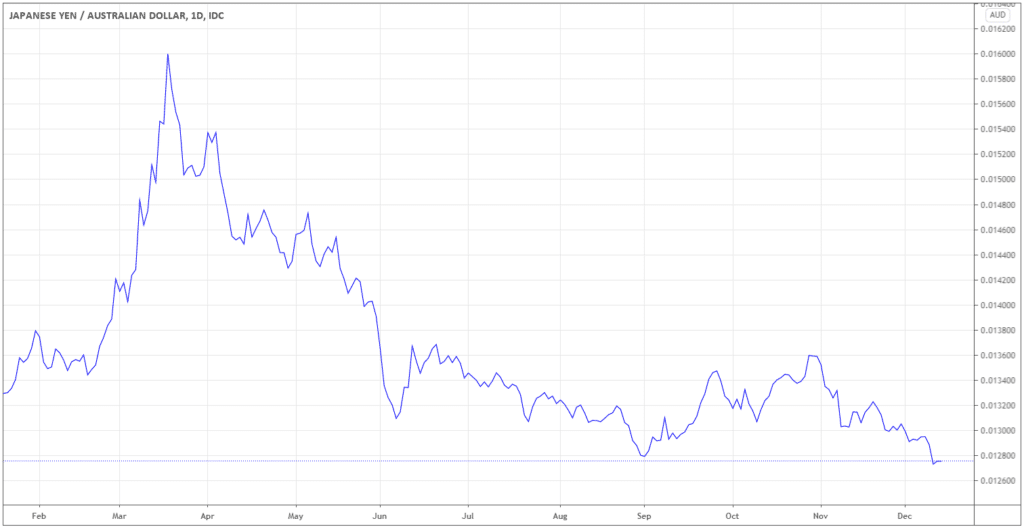
The inverted (JPY/AUD) pair just broke down the September low, confidently heading south.
Bonds, staples, gold, and currencies suggest that the stock market is heading higher. The lower lows are the prerogative of bearish markets. If safe havens are in the downtrend, where do you think the money goes? As the evidence above suggests, the US equities are poised to go up.
S&P 500 trading tactics
If we buy the S&P 500 index, what’s the best way to do that? Let’s look at the chart below to get around.
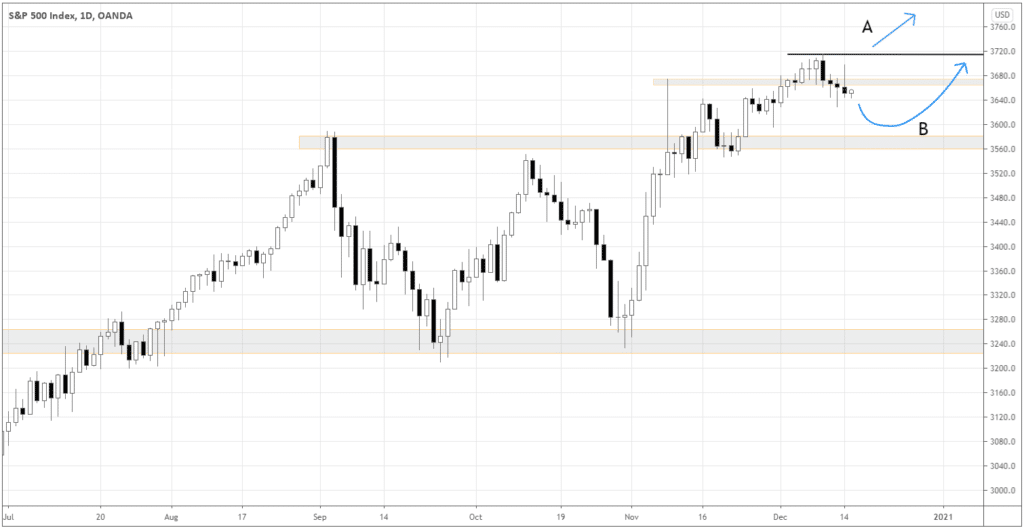
We can see that a possible resistance around 3680 that was initially formed by the vaccine news spike is quite blurred. The key areas here are the support around 3560 and the all-time high near 3720.
Therefore, I expect two major scenarios in a short-term:
A) The market breaks out above the all-time-high shortly and continues the advance with the increasing momentum. We can buy if we see a full-body day candle with the close above 3720.
B) The market retraces to 3560 and gradually advances from there. To buy, we need a rejection price action such as a hammer or engulfing candlestick patterns near 3560.
Final words
The downtrend in DXY suggests that it’s time to look into the risk assets. Four different Intermarket indicators provide us with the clues that the stock market is about to continue the uptrend. According to the two scenarios of the short-term price action of the S&P 500, we can buy the index based on either a breakout or a rebound setup.


