A wedge pattern is a chart pattern that is formed by two trend lines coming together. Wedges can communicate either a continuation or a reversal of price action.
There are two types of wedges: Rising Wedges and Falling Wedges. A bearish reversal is indicated by rising wedges after an uptrend, whereas a bullish reversal is indicated by falling wedges after a downtrend. For the most part, a wedge represents a market consolidation area bound by two sloping support and resistance lines that will eventually come together and meet. Even though the price moves in the same general direction, the speed at which the two extremes are generated differs.
Rising wedge pattern
A rising wedge is formed by the convergence of two trendlines following a period of the sustained uptrend. Immediately prior to the line converging, sellers enter the market, and as a result, prices begin to lose their upward momentum. Under such circumstances, price trend lines are broken when prices move above or below them. The trend will either continue or reverse based on where the rising wedges are located.
Rising wedge in an uptrend
The formation of reversal patterns in uptrends with rising wedges occurs when the price begins to make higher highs and higher lows. (See chart below.) The most common way to look for an impending reversal is by looking for signs of ranging.
A price range for contracting can easily be seen. As can be seen on the chart below, the price range indicates an oncoming upswing following the wedge’s creation. The price action is constricted within the area covered by the two trend lines. The lines progressively move closer to each other as time goes by, giving rise to a reversal.
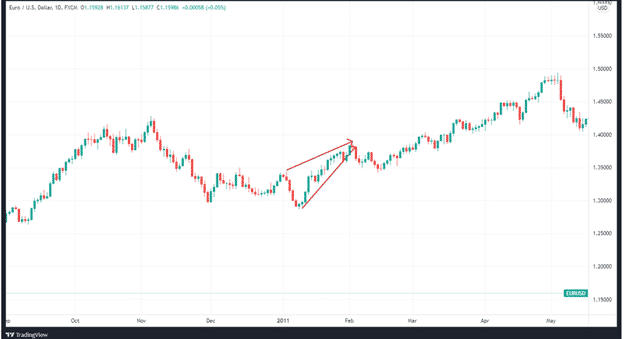
When momentum weakens, it usually means a downward reversal is about to occur. Because of this, you will be able to find potential trading opportunities.
Rising wedge in a downtrend
An upwardly trending wedge in a downtrend denotes a short-term price movement in the opposite direction or a market retracement. It is similar to a rising wedge because prices are initially constrained to two parallel lines, but they then merge into a single line as the downtrend is formed.
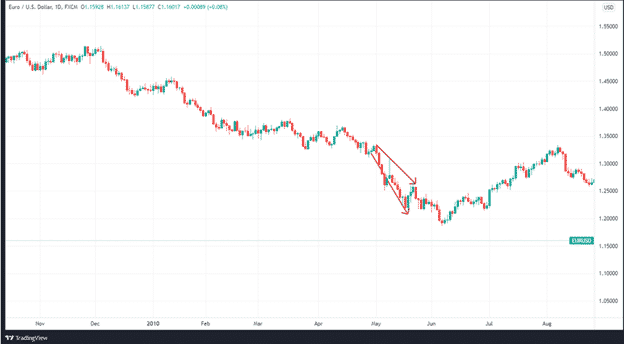
Furthermore, this implies that the decline will continue, so watch for selling opportunities.
When the trend is going down, you’ll see patterns like the ones shown in the chart above.
How to trade a rising wedge
Strategy 1
One way to profitably short an asset is by placing a stop order just below the bottom of the wedge following a break. Safeguard yourself against false breakouts by not entering the market until after a candlestick closes below the bottom trend line.
In the chart below, you can see where price breaches the lower support and where to place a sell order:
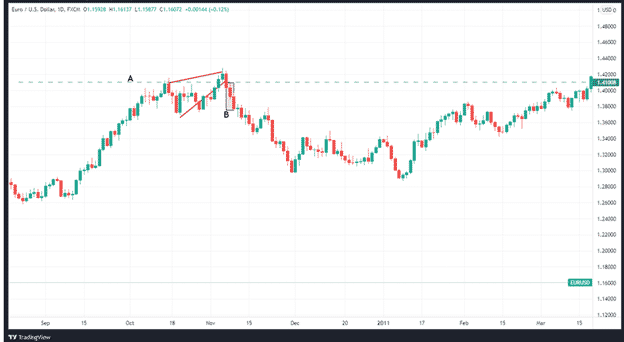
A) Shows where the price breaks the support
B) Shows placing the sell order on a short position.
As shown on the chart below, the best position to place your stop loss is on the upper side of the rising wedge.
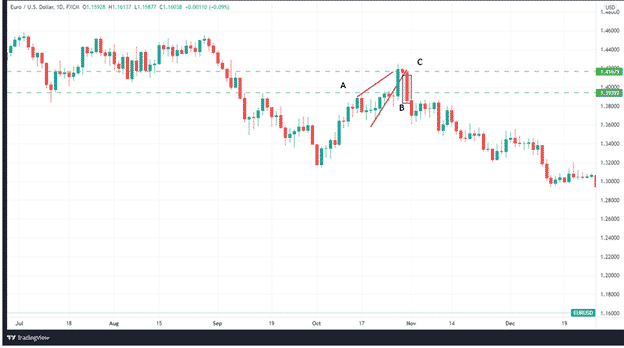
Label (A) shows the level at which the price breaches the support level and goes on to trade below it.
Label (B) shows the best position for the sell order in a short entry
Label (C) is the stop loss
Lastly, we have a chart displaying the profit target.
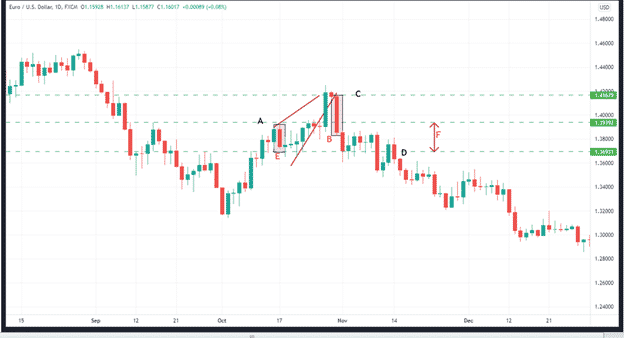
Label (A) Shows the level at which the price breaches the lower support and proceeds to trade below it.
Label (F) shows the height of the backside of the wedge (from E to A), which is used to establish the entry position at B and take profit order at D.
Label (B) shows the sell order for a short position.
Label (C) shows the stop loss.
Label (D) is the take profit level.
Strategy 2
The second strategy is to let the price breach the support level and place a sell order once the price reverts back to retest the trend line. In this strategy, the support level that was previously broken becomes the resistance level.
The following chart illustrates how to put in a sell order.
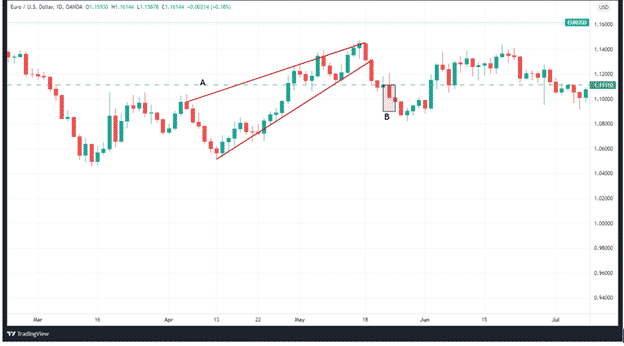
Label (A) shows where the price meets resistance at the wedge’s bottom. Label (B) shows the appropriate entry-level for a short position.
It would be prudent to place a stop-loss order above the newly-established resistance level.
Falling wedge pattern
During a period when an asset’s price has been declining, it ends up creating a falling wedge if the two trend lines come together.
Just before the lines converge, buyers flock to the market, thereby slowing down the price decline. Consequently, the price breaks from the upper trend line.
The trend will either continue or reverse based on where the falling wedges land. As a result of the pattern’s dual interpretation as a bullish continuation as well as a bullish reversal pattern, it’s easy to miss the falling wedge. Both possibilities relate to varied market conditions that must be considered while making a decision.
Among the factors to consider in determining whether we have a continuation pattern or if a reversal is imminent is the trend line’s direction of alignment following the appearance of the falling wedge. You will know that a continuation is in play when it appears on the uptrend. However, if it shows up on the downtrend, that is a sign of a reversal.
In a continuation/reversal pattern, do the following:
Determine whether there is an upward trend or (downtrend).
- A trend line can be used to connect lower highs and lower lows. As the two lines come together, they will have a downward slope
- Wait for the price to go above the resistance level, then take a long position.
In summary
Wedges are types of chart patterns that can serve as indicators of a continuation or a reversal. Most traders consider wedges to be extremely dependable and include them among their most often used chart patterns. Knowing how to use them appropriately can help you reduce risk exposure and increase your profit margins.


