The stochastic oscillator is a widely used momentum indicator in the forex trading community, used mainly to pinpoint potential trend reversals by measuring momentum. Momentum is measured by comparing the closing price to the trading price, over a defined time period.
Since the stochastic oscillator is range-bound in nature, it usually expresses itself in the range of 0 to 100, making it a useful indicator of overbought and oversold conditions in the forex market. As a rule of thumb, any reading under 20 is considered oversold, and above 80 is considered overbought. This, however, is not always indicative of an impending reversal. Traders thus look at changes in the stochastic oscillator, for getting clues about any future trend shifts.

Creating a Forex Strategy Using Stochastic Oscillator
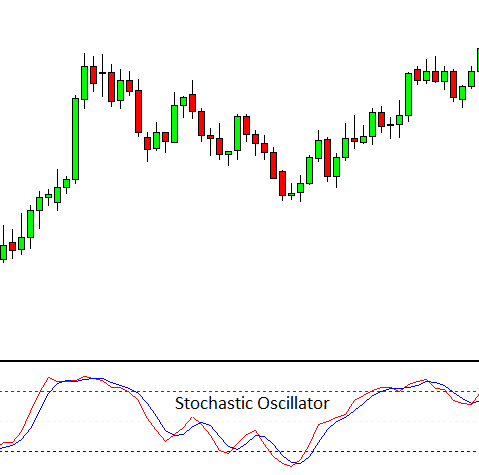
Like a number of other range-bound momentum oscillators such as the RSI, the stochastic oscillator is used for determining overbought and oversold conditions. It consists of the two lines, with one being the indicator itself, denoted by “%K” and the other is the signal line, denoted by “%D”. %D is calculated as the three day simple moving average of %K. A trend shift is said to have been signaled when these two lines intersect each other.
For example, if a downward cross through the signal line is seen in a chart with a pronounced bullish trend, it may indicate that the most recent closing price is closer to the lowest low of the look-back period, compared to all previous three sessions. On the other hand, a sudden drop to the lower end of the trading range after a sustained upward price action, may signify that the “bulls are losing steam” .
For traders looking to create a trading strategy based on using the stochastic oscillator, they should look for a currency pair which has a lengthy and pronounced bullish trend. This currency pair should have already spent some time in overbought territory, with its price coming closer to a previous area of resistance. An additional indicator for spotting bullish exhaustion can be waning volume. The trader then has to wait till the stochastic oscillator crosses down the signal line, after which the price should follow suit. These combined signals are considered a strong indicator is an impending reversal. However, to be absolutely sure, traders should wait patiently for the price to confirm the downturn before its entry. This is a precaution as stochastic oscillators are known for producing false signals on occasion. Using this indicator along with candlestick charting techniques can provide a solid foundation for any trader’s forex strategy, providing clear entry and exit signals.
Differences between Relative Strength Index and Stochastic Oscillator
Many traders also consider the use of the relative strength index or RSI in their technical analysis, which is also considered as an important momentum oscillator. Traders use both the indicators together, even though they have differing methods and underlying theories behind them. The RSI is responsible for tracking overbought and oversold levels by measuring the velocity of price movements.
The stochastic oscillator on the other hand, is entirely based on the assumption that closing prices tend to close near the same direction as the existing current trend. Thus we can safely say that while the stochastic oscillator works best in consistent trading ranges, the RSI is used as a measurement tool for changes in the speed of price movements. This is why RSI is suited for trending markets, while stochastic work well in sideways or choppy markets.
Disadvantage of the Stochastic Oscillator
As mentioned before, the stochastic oscillator tends to mistakenly produce false signals on occasion, considered as one of its biggest weaknesses. This happens when a trading signal is generated, but the price does not follow through. This can end up as a losing trade for the trader. This tends to occur more during volatile market conditions. While there are no definitive solutions to this problem, traders can take price trend as a filter and take signals which are specifically on the same direction as the trend.
Conclusion
The Stochastic oscillator offers huge versatility when it comes to trading. It is used either independently, or in combination with other indicators such as the Moving Average Convergence Divergence and the Relative Strength Index. The latter two indicators can be used to look at signals which are in agreement with the stochastic oscillator, confirming the indication. It is sensitive to momentum rather than the absolute price. It tends to work best when used as a standard MetaTrader 4 indicator inside the platform, as some custom-made, third party stochastic might slow down performance.
Thus, before using the stochastic oscillator properly, traders should gather detailed information on the indicator beforehand, and have a minimum level of technical knowhow and experience to implement properly. It is included in almost all forex charting tools with a standard time period being 14 days.


