ForexEzy
No Result
View All Result
  • Top Forex Advisors
    • Best Forex Robots
    • Best Forex Signals
    • Best Managed Accounts
  • Top Forex Brokers
    • Best Forex Brokers
    • US Forex Brokers
    • UK Forex Brokers
    • MT4 Forex Brokers
    • MT5 Forex Brokers
    • Zero Spread Brokers
    • Best PayPal Brokers
    • TradingView Brokers
    • Social Trading Platforms
  • Top Review Platforms
  • Forex Education
    • Getting Started
    • Forex Basics
    • Forex Trading Strategies
    • Money Management
    • Risk Management
    • Technical Analysis
    • Fundamental Analysis
    • Trading Psychology
    • Social Trading
    • Automated Trading
  • Forex Tools
    • Forex Robots
    • Forex Indicators
    • Forex Signals
    • Forex VPS
  • Forex Forecast
  • Crypto
    • Best Crypto Exchanges
    • Best Crypto Bots
    • Crypto Guides & Forecasts
No Result
View All Result
ForexEzy
No Result
View All Result
The World’s Leading Social Trading Platform
Try now
Home Forex Education Technical Analysis

How to Trade with “Kagi” Charts in the Forex Market

by Adam Stanley
May 12, 2020
in Technical Analysis
0
kagi chart
1
SHARES
11
VIEWS
Share on FacebookShare on Twitter

There are several charting and technical analysis techniques that concentrate on the important moves that act as drivers behind a trend of any asset, filtering out noise in the process. One such chart is called the Kagi Chart. Initially used in the 1800s in Japan, Kagi Charts are used for discounting the time seen on a regular price chart. Kagi charts are time-independent, unlike candlesticks and bar charts, and display the potential supply and demand level for any particular asset. 

Many traders tend to view Kagi charts as a critical component when using price action. They only reveal the price changes that matter, filtering the noise in the market. In other words, it tracks the price movement of the market, considering only one variable, the price. 

The Best Forex Robots Report Is Already Here!
best forex robots
Check out 30+ best expert advisors with daily updated live results and statistics
Click Here

Understanding the Kagi Charts

Kagi charts can be used in a way to make the most of any market and ride trends. At a glance, the Kagi chart looks almost like a snake, consisting of a line that rises and falls on the screen. It should be known that Kagi charts are just a newer variant of time-independent charts from Japan. Kagi charts account only for the relevant price action and as a result, it filters for the specific days when price moves less than the minimum distance needed. 

When the price exceeds a predetermined distance, Kagi charts plot a new value. This distance varies according to the nature of the market. It should also be noted that Kagi charts originated in Japanese rice markets where price movements followed specific patterns. This environment was much different than the currency markets of today. 

The nature of the modern currency market is that it consists of multiple pairs. The price action of each currency pairs differs from each other, with some pairs possessing an extended price range on a daily basis, while other pairs are known for consolidating more. Thus, Kagi charts would not be relevant if the trader uses the same pre-determined price change for all markets, as each market possesses its own unique characteristics.

Using Kagi Charts to Trade in Modern Markets

Before diving into how traders can use Kagi charts to trade in financial markets, it should be known that Kagi charts are not commonly available on all trading platforms. For instance, Meta Trader 4, one of the most popular trading platforms among retail traders, does not offer Kagi charts by default. However, a trader may import a custom indicator and use it to build a Kagi chart, which usually comes at a cost and does not possess the default settings. Even other platforms such as TradingView charge a cost for using Kagi charts in lower timeframes that show price action.

How to Ride Trends with Kagi Charts?

When applied to Kagi Charts, trend lines can be better used, as Kagi charts show relevant market moves. We will take the example of a GBP/USD price action since 2014. 

kagi chart

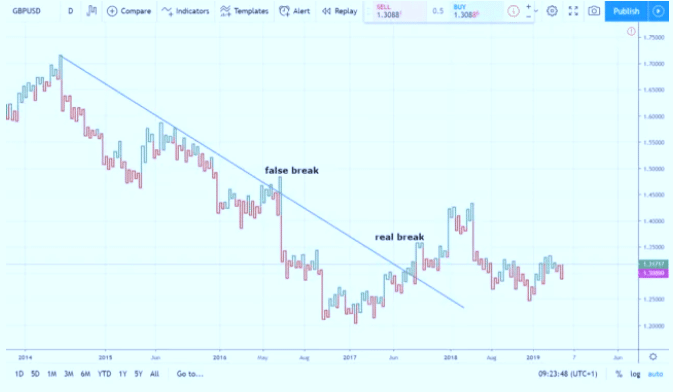
Here, the bearish trend suffers a false break which is easily filtered by the trendline. In the chart, we see that the “shoulder” reverses and closes below the trendline level, notifying the traders that the trend remains intact. The price has tried to break the trendline twice in a row but failed miserably in both instances. In the end, we see that the price eventually breaks higher, which is signified by the “shoulder” ending above the bearish trendline. Even if it lags a bit, it helps the trader remain in the relevant trend. 

Thus the following points can be summarised about how the Kagi chart can help a trader. 

  • It helps to better define both bearish and bullish trends. 
  • The trendlines which are produced have more relevance for the price action. 
  • This makes it easy to spot and interpret false and real breaks. 

Divergences with Kagi Charts

Trading divergences are one of the most popular ways for traders to trade with oscillators. They can always rely more on what the oscillators show as compared to what price tells them. This is because oscillators consider multiple periods before plotting a value. 

The oscillator’s information is considered more important in the case of Kagi charts. An oscillator placed on a regular candlestick chart normally uses a standard period. For instance, it’s 14 in the case of the Relative Strength Index.

In the case of the Relative Strength Index, the oscillator checks the previous 14 candlesticks on the main chart. The RSI formula is then applied, which finally plots a value based on the result.

However, in Kagi Charts, the formula is applied on the specific periods where price movement occurred according to “Kagi’’ rules. Thus, the period involved, which starts from 14, can expand in time to much more than 14 days. 

Divergence Example on the AUD/USD Kagi Chart

When an oscillator fails to confirm the second higher high in a bearish divergence, or the second lower low in a bullish divergence, both the price and the oscillator is said to diverge. 

kagi chart

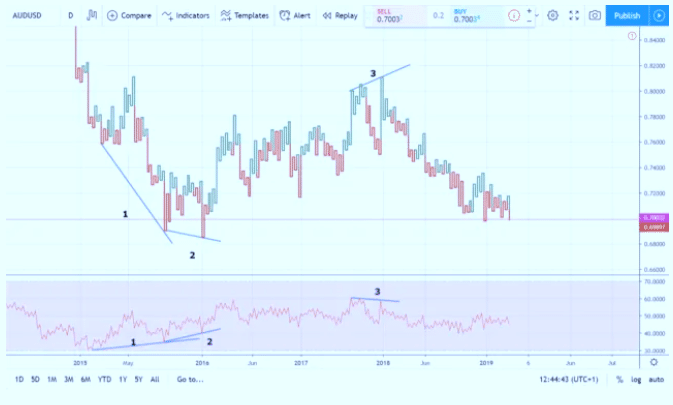
On the above AUD/USD daily chart, the RSI (14) is shown. Here, however, the RSI doesn’t consider the last 14 trading days, instead of focusing on the last 14 days where the Kagi charts changed. On the chart above, the RSI values indicate that the price reached oversold conditions only once between 2015 to 2019. Thus, it is irrelevant for a trader using Kagi charts to wait for oversold or overbought conditions.
In this situation, it makes more sense to use divergences. As it filters the market noise, Kagi divergences are much more powerful than regular divergences.

In the first chart, we see that the Kagi charts are making two new lower lows. The Relative Strength Index, however, enters a divergent mode after failing to make a new lower low. However, in the Kagi chart above, the price pushes for another lower low. The RSI, however, fails to confirm this as well. 

The Relative Strength Index thus forms a double bullish divergence, making it more powerful than normal, as it appears on a Kagi chart. Here, the price jumps by about 1000 pips from when the double bullish divergence is formed, eventually reaching values over 0.8, forming a bearish divergence with the Relative Strength Index. 

Conclusion

In the 21st century, building Kagi charts have become simple. However, traders should know how to correctly interpret them and know what they stand for, before attempting to trade with them. 

The Best Forex Robots Report Is Already Here!
best forex robots
Check out 30+ best expert advisors with daily updated live results and statistics
Click Here
Tags: forex charts
Share1Tweet
Previous Post

The Best Combinations of Forex Indicators for Day Trading

Next Post

Forex Mentor Review

Related Posts

Trading With Balance of Power Indicator

Trading With Balance of Power Indicator

by Adam Stanley
December 9, 2021
0

The Balance of Power (BOP) indicator is an analysis tool created by Igor Livshin in August 2001. It tracks the...

What Are Pennant Chart Patterns in Forex: Step by Step Guide

What Are Pennant Chart Patterns in Forex: Step by Step Guide

by Chintan Patel
November 15, 2021
0

Continuation patterns in the forex market are a common occurrence whenever there is a large movement in one direction followed...

How To Trade Ascending Scallops in Forex

How To Trade Ascending Scallops in Forex

by Adam Stanley
November 10, 2021
0

Price in the Forex market does not always move in one direction. After a significant move in one direction, up...

Inverted Scallops in Forex Chart Patterns: Step by Step Guide

Inverted Scallops in Forex Chart Patterns: Step by Step Guide

by Adam Stanley
November 9, 2021
0

Whenever prices move up significantly in the forex market, exhaustion often kicks in. In most cases, the fatigue is usually...

Elder’s Method in Forex Trading

Elder’s Method in Forex Trading

by Tim Baudin
November 3, 2021
0

There are several strategies that traders and analysts have developed over the years, all in a bid to milk the...

Load More

Leave a Reply Cancel reply

Your email address will not be published. Required fields are marked *

Best Forex Automated Systems

  • TechBerry 9/10
  • Happy Galaxy 8.5/10
  • Forex Cyborg 8.5/10
  • Forex Fury 8/10
  • FXgoodway 7.5/10
  • Best Forex Brokers
  • Best Forex Robots
  • Best Forex Signals
  • Best Forex Managed Accounts

Top Trading Markets

We are dedicated to demystify the world of forex trading for you – no matter what level you are on.

Categories
  • Automated Trading
  • Crypto Robot Review
  • Cryptocurrency Trading
  • Day Trading
  • Forex Basics
  • Forex Brokers
  • Forex Education
  • Forex Forecasts
  • Forex Indicators
  • Forex Market Commentary
  • Forex Robots
  • Forex Signals
  • Forex Signals
  • Forex Tools
  • Forex Trading Strategies
  • Forex VPS
  • Fundamental Analysis
  • Managed Accounts
  • Money Management
  • News
  • Review
  • Review Platforms
  • Risk Management
  • Social Trading
  • Technical Analysis
  • Top World Traders
  • Trading Apps
  • Trading Psychology
  • Uncategorized
Tags
Acquisition AI Amazon Apple Artificial Intelligence Bitcoin bond yields CEO China earnings earnings report economy Electric Vehicles Federal Reserve financial performance Financial Results forex ea forex software reviews Growth Guidance Housing Market inflation interest rates Investing investment Investors Market Volatility merger mortgage rates net profit Nvidia Oil prices Q2 Results revenue Revenue Growth Sales sales growth Stock Futures stock market stock performance Stocks strategies technology Tesla Video
  • Terms of Use
  • Privacy Policy
  • Compensation Disclosure
  • Risk Disclosure
  • About Us
  • Contact Us

Copyright © 2023 by ForexEzy.com

No Result
View All Result
  • Top Forex Advisors
    • Best Forex Robots
    • Best Forex Signals
    • Best Managed Accounts
  • Top Forex Brokers
    • Best Forex Brokers
    • US Forex Brokers
    • UK Forex Brokers
    • MT4 Forex Brokers
    • MT5 Forex Brokers
    • Zero Spread Brokers
    • Best PayPal Brokers
    • TradingView Brokers
    • Social Trading Platforms
  • Top Review Platforms
  • Forex Education
    • Getting Started
    • Forex Basics
    • Forex Trading Strategies
    • Money Management
    • Risk Management
    • Technical Analysis
    • Fundamental Analysis
    • Trading Psychology
    • Social Trading
    • Automated Trading
  • Forex Tools
    • Forex Robots
    • Forex Indicators
    • Forex Signals
    • Forex VPS
  • Forex Forecast
  • Crypto
    • Best Crypto Exchanges
    • Best Crypto Bots
    • Crypto Guides & Forecasts

© 2023, Forexezy. {copy} {year}