
There are many traders worldwide who tend to apply more than a dozen technical indicators for a more profitable experience. However, instead of helping them gain substantial profits, most of these indicators either contradict each other with the trading signals they generate or provide the same information. This can cause confusion in the mind of a trader, which can ultimately lead to whipsaws and losses. Thus, in situations where a trend indicator prompts to buy while an oscillator prompts to sell, finding the best combination of forex indicators can be pretty problematic.
However, there are ways in which a trader can combine different indicators and apply them to different timeframes, in an attempt to minimise fake signals, as well as taking advantage of the strengths of the indicators.
How to Trade with Technical Indicators
Technical indicators are one of the most useful tools in a trader’s arsenal. However, relying on them solely while making trading decisions can have negative consequences. There is quite a bit of discussion regarding which indicator or combination of indicators to use during day trading. This is because, a trend-following indicator may give the trader a buy signal when the trend is up, while an oscillator may send him/her a sell signal when it reaches overbought territories. Consequently, during uptrends, a trend-following indicator may trigger a sell signal, while an oscillator becomes oversold, telling the trader to “buy”.
Traders can take advantage of technical indicators during day trading by combining different timeframes. They can combine different trend-following indicators with oscillators for seeking out trade setups possessing high winning rates. One way to do this is to develop a robust, well-defined strategy, and apply the indicators to easily interpret the trading signals derived from the strategy.
Different Types of Indicators
There are several indicators available for traders. They are categorised on the basis of how they follow underlying price-actions.
- Trend indicators: Trend indicators measure the direction and strength of a trend. A trend indicator gives a trader a “buy” signal when the market is in a strong uptrend. Consequently, they give the trader a “sell” signal when the market is in a strong downtrend.
Examples: Parabolic Stop and Reverse, Average Directional Movement Index (ADX), Moving Average Convergence Divergence (MACD)
- Volatility Indicators: This indicator measures the rate of price changes regardless of the direction they follow. Volatility indicators fall when markets are slow, and rise when markets are fast.
Examples Bollinger Bands, Average True Range(ATR) - Momentum Indicators/Oscillators: Momentum indicators are another popular group of technical indicators. They are also called oscillators and measure the relative strength of recent price-moves, plotting a value between 0 to 100.
Example, Relative Strength Index. - Volume Indicators: These indicators use the information of trading volume to measure the strength of a price move. They are mainly used by stock traders.
Example, On Balance Volume (OBV)
The Triple Screen System
Invented by Elder Alexander in or around 1986, the Triple Screen system is used to identify trade setups that have a high probability of being successful. It employs a combination of trend following oscillators and indicators to reduce the number of false signals, applying them on different timeframes. When applied to the same timeframe, the indicators would provide contradictory signals. This means, that when markets are in an uptrend, a trend indicator would tell the trader to “buy”. Similarly, an oscillator would send a signal to sell when it enters the overbought territory.
Screen 1: Market Tides
Below, we take the example of the NZD/CHF 4-hour chart.
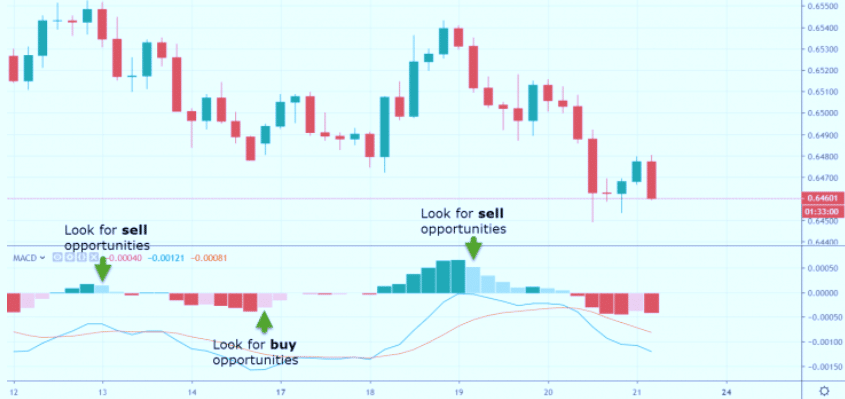
In the above MACD histogram, traders would look for buying opportunities when the histogram ticks higher, and look for selling opportunities when the histogram ticks lower. When the histogram tick’s lower, traders should look for selling opportunities on the second screen.
Screen 2: Waves
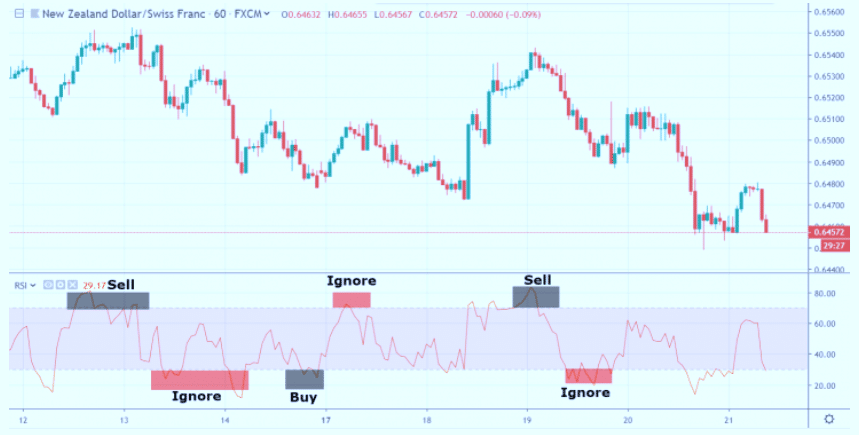
The above is a one-hour chart for the NZD/CHF pair. In the second screen of the triple screen system, an oscillator such as RSI, is applied to identify oversold and overbought market conditions. Traders should look for price corrections going against the trend identified in the first screen.
For instance, if there is a downtrend with the MACD histogram ticking lower, traders need to wait for the RSI to become overbought, or over 70, to enter a sell position. Traders should ignore the buy signal generated by the RSI if it becomes oversold, ie. Below 30. This is due to the trade is against the overall trend in the first screen.
Screen 3: Ripples
The third screen represents market ripples. Here, if the first screen shows an uptrend, the oscillator becomes oversold in the second screen, showing a buy signal. Traders should look for short term resistance levels in the third screen and consequently place a buy stop above those levels by a few pips.
Consequently, if the first screen shows a downtrend, the oscillator in the second screen becomes overbought, showing a buy signal. Traders should look for short-term support levels in the third screen, placing a buy stop, a few pips above the support levels.
A stop-loss order should be placed a few pips above the high of the one-hour candle in case of a sell setup. Similarly, a stop-loss order should be placed below the one-hour candle or below a recent support level in case of a buy setup.
Thus, the first screen identifies the overall market trend using the MACD indicator. This is followed by the second screen scanning for trading opportunities using an oscillator in the direction of the overall trend. Finally, the third screen provides potential entry points, triggering a trade.
Trading with technical indicators should not replace the trader’s trading strategy
Traders should be aware of the disadvantages of each technical indicator before they risk their capital. Traders are thus advised to focus only on a couple of indicators and learn their characteristics in-depth instead of using dozens of indicators. It should always be known that a trend following indicator only works well in trending markets. They tend to give false signals once the market starts to rise.
Oscillators also have their downside, as they are consistently profitable in a ranging market, but tend to give premature or dangerous signals in a market starting to trend.
In conclusion, the triple screen system attempts to minimise the above disadvantages by combining both oscillators and indicators on different timeframes. They take advantage of taking the trades which are only in the direction of the overall trend.


