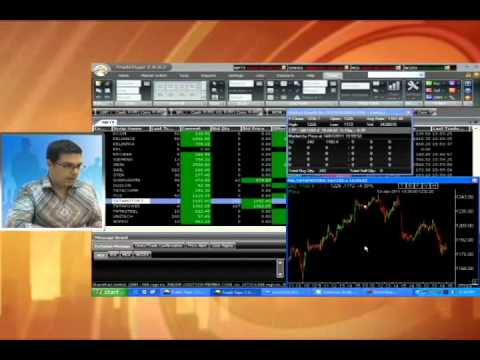
Below video goes over a Relative Strength Index (RSI) strategy for day trading.
https://www.youtube.com/watch?v=QNEV45FvTa4
How to apply the RSI indicator with Moving Average for Metatrader 4
The strategy in the video uses the 5-minute chart of Tata Motors. We’ll use the 5-minute EUR/USD chart, so open a new blank 5-minute chart of this currency pair.
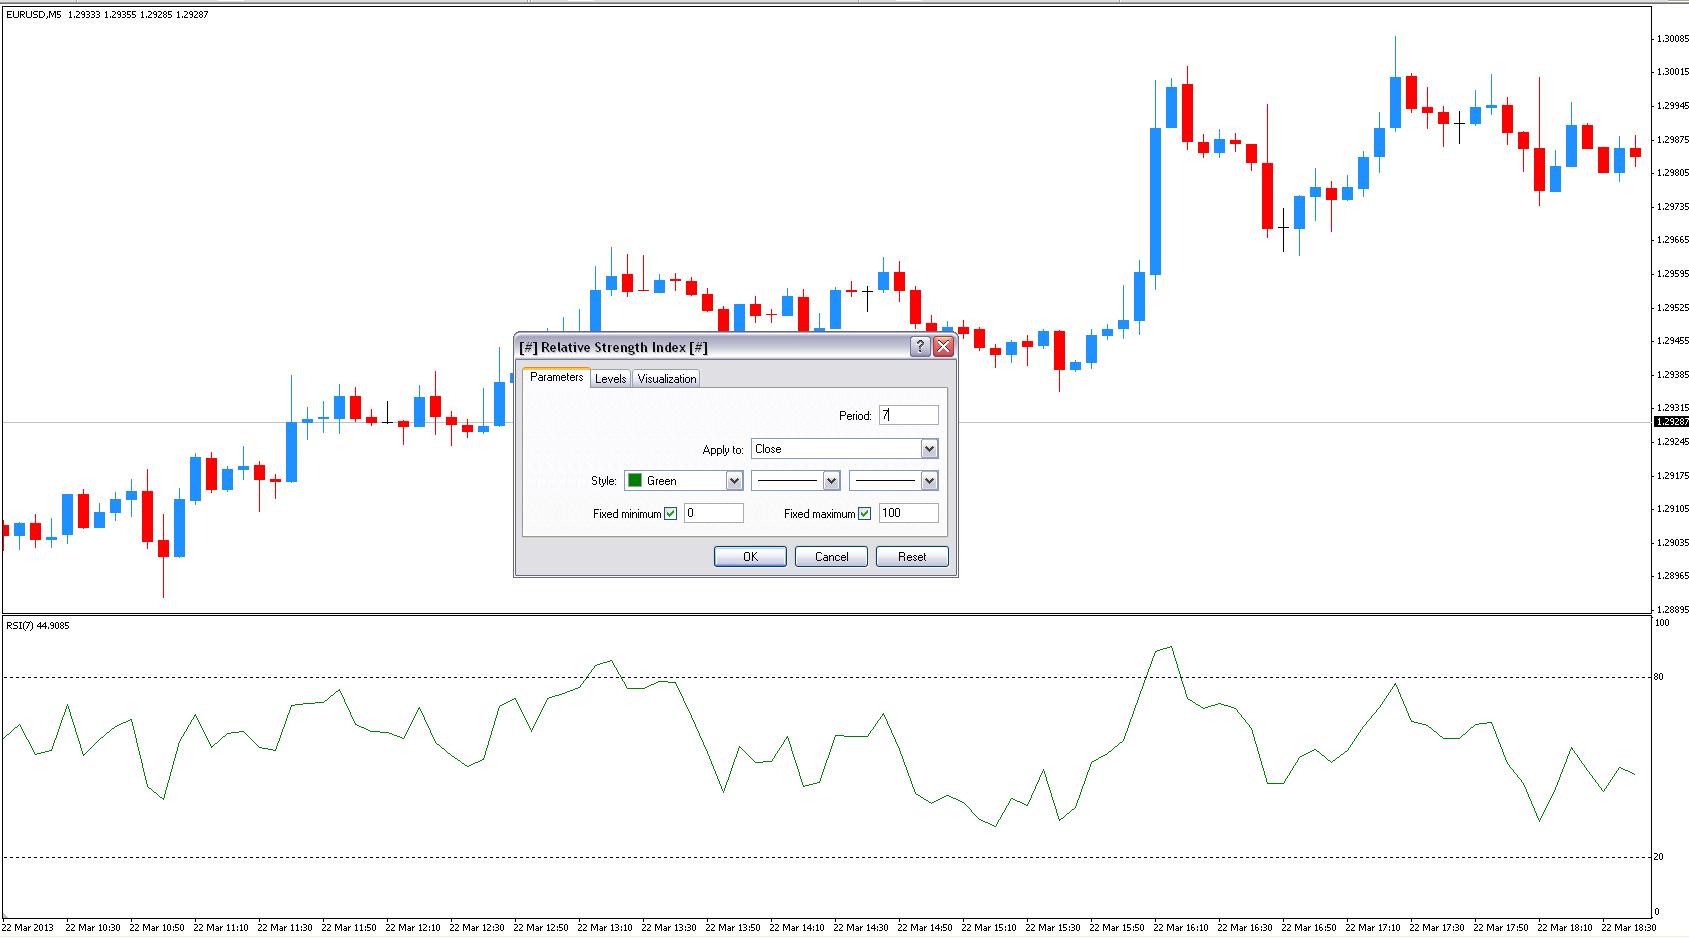
Next step is relatively easy, go to Insert > Indicators > Oscillators and pick the Relative Strength Index. You’ll be presented with the screen below. Now use the settings exactly as shown in the picture below, pick a 7 period RSI applied to the close price.
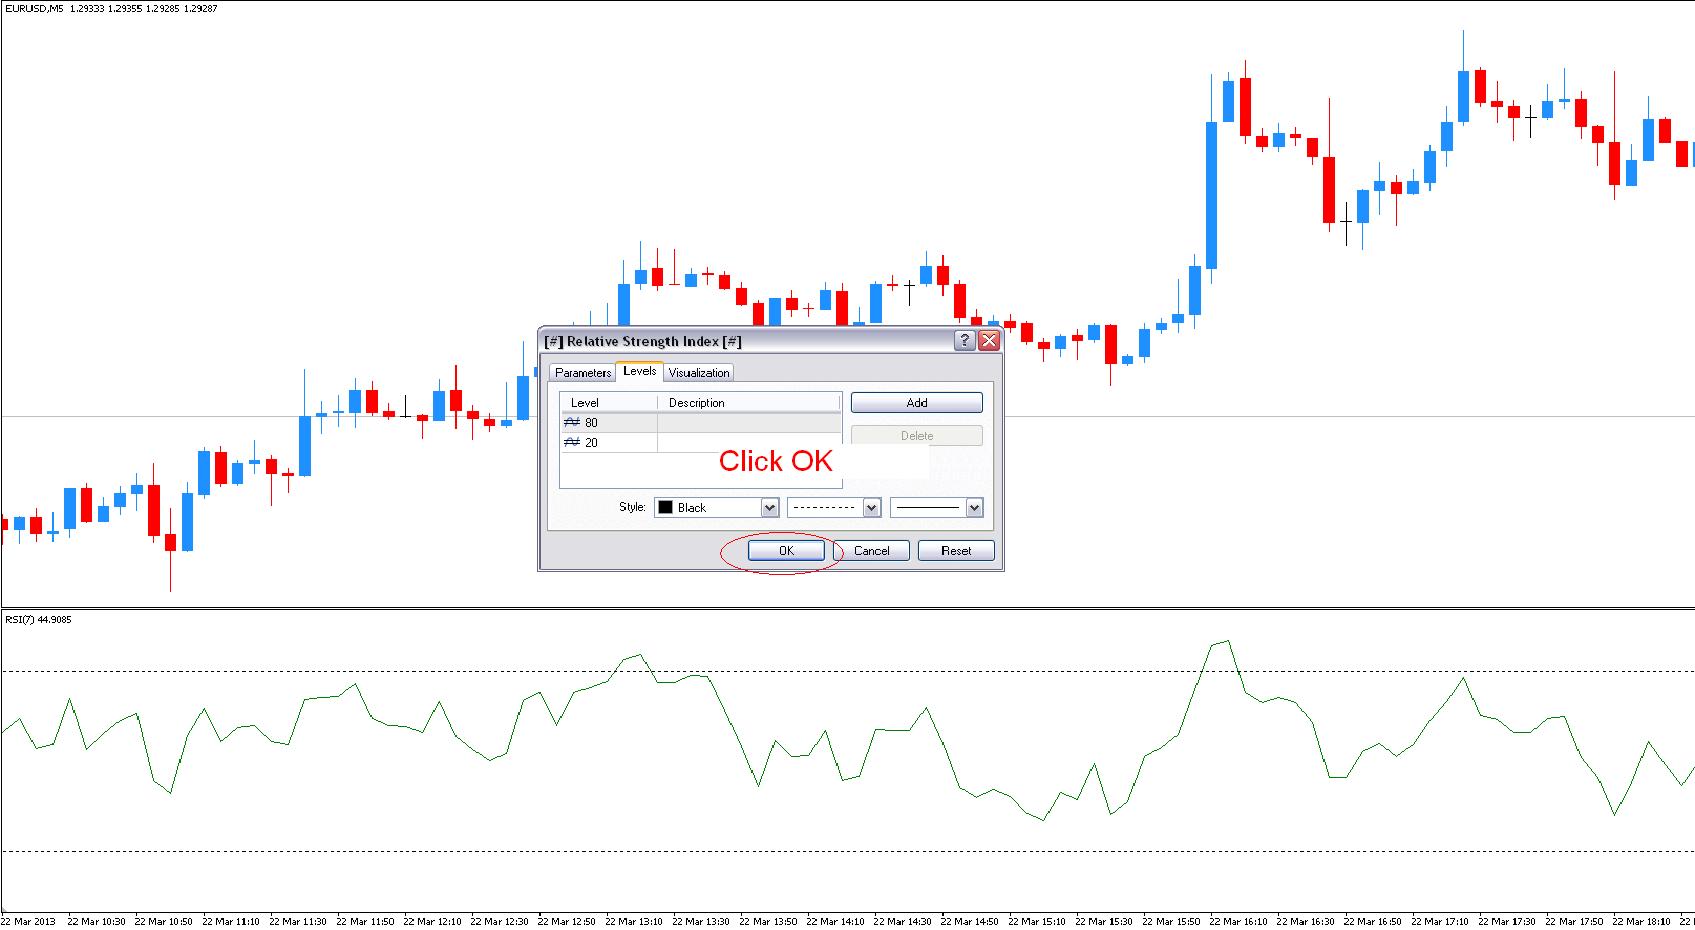
Now go to the levels tab. Usually, the default levels for the RSI trading indicator are set at 70 and 30 but this strategy uses 80 and 20 instead, so change the default values like shown on the picture below and click OK.
You’ve now applied the RSI, in the next step we will apply the Moving Average to the RSI.
How to Plot an Indicator to another Indicator in Metatrader 4
To apply the Moving Average to the RSI is a bit tricky in MT4. In fact, even many seasoned users of the Metatrader 4 platform don’t know how to apply an indicator to another indicator.
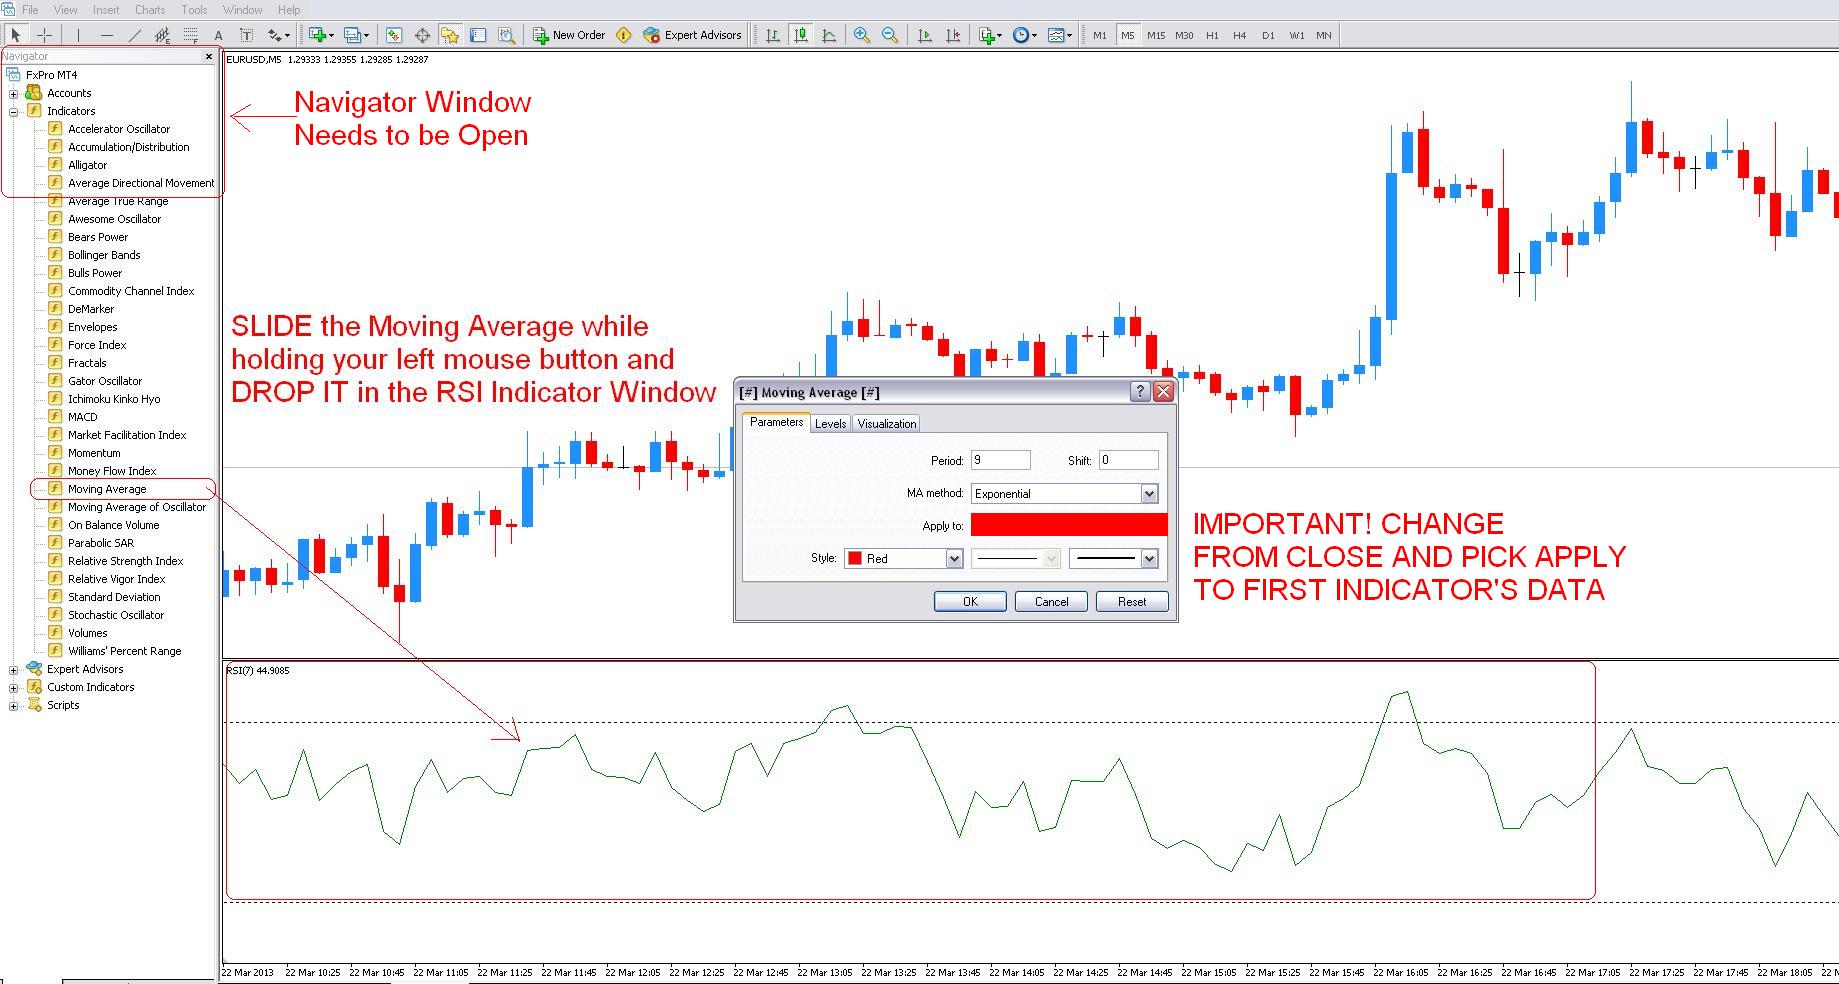
First, you need to have your Navigator open, if it’s closed go to View > Navigator. Now go to Indicators and expand it so that you can see the Moving Average indicator.
You now SLIDE the Moving Average while holding your left mouse button and DROP IT to the RSI Indicator Window as shown in the picture below.
After you successfully do this, you will be prompted to pick the settings for the Moving Average Indicator. Pick a 9 Period Moving Average and pick Exponential from the method tab.
IMPORTANT! In the APPLY TO FIELD pick Apply to First Indicator’s Data. If you use any other options here the Moving Average will just go to the main indicator window and not in the RSI window. Then click OK. That wasn’t so hard was it?
Unfortunately, the video gives little clues as so how you actually trade with this setup. The only clue is that once the RSI gets into an oversold zone, below 20, you should LOOK FOR a buy signal. The wording used implies that there is some discretion involved in the process which the video doesn’t go into. The exit is presented in a similarly vague manner. You should LOOK FOR an exit from the long position once the RSI gets over 80.
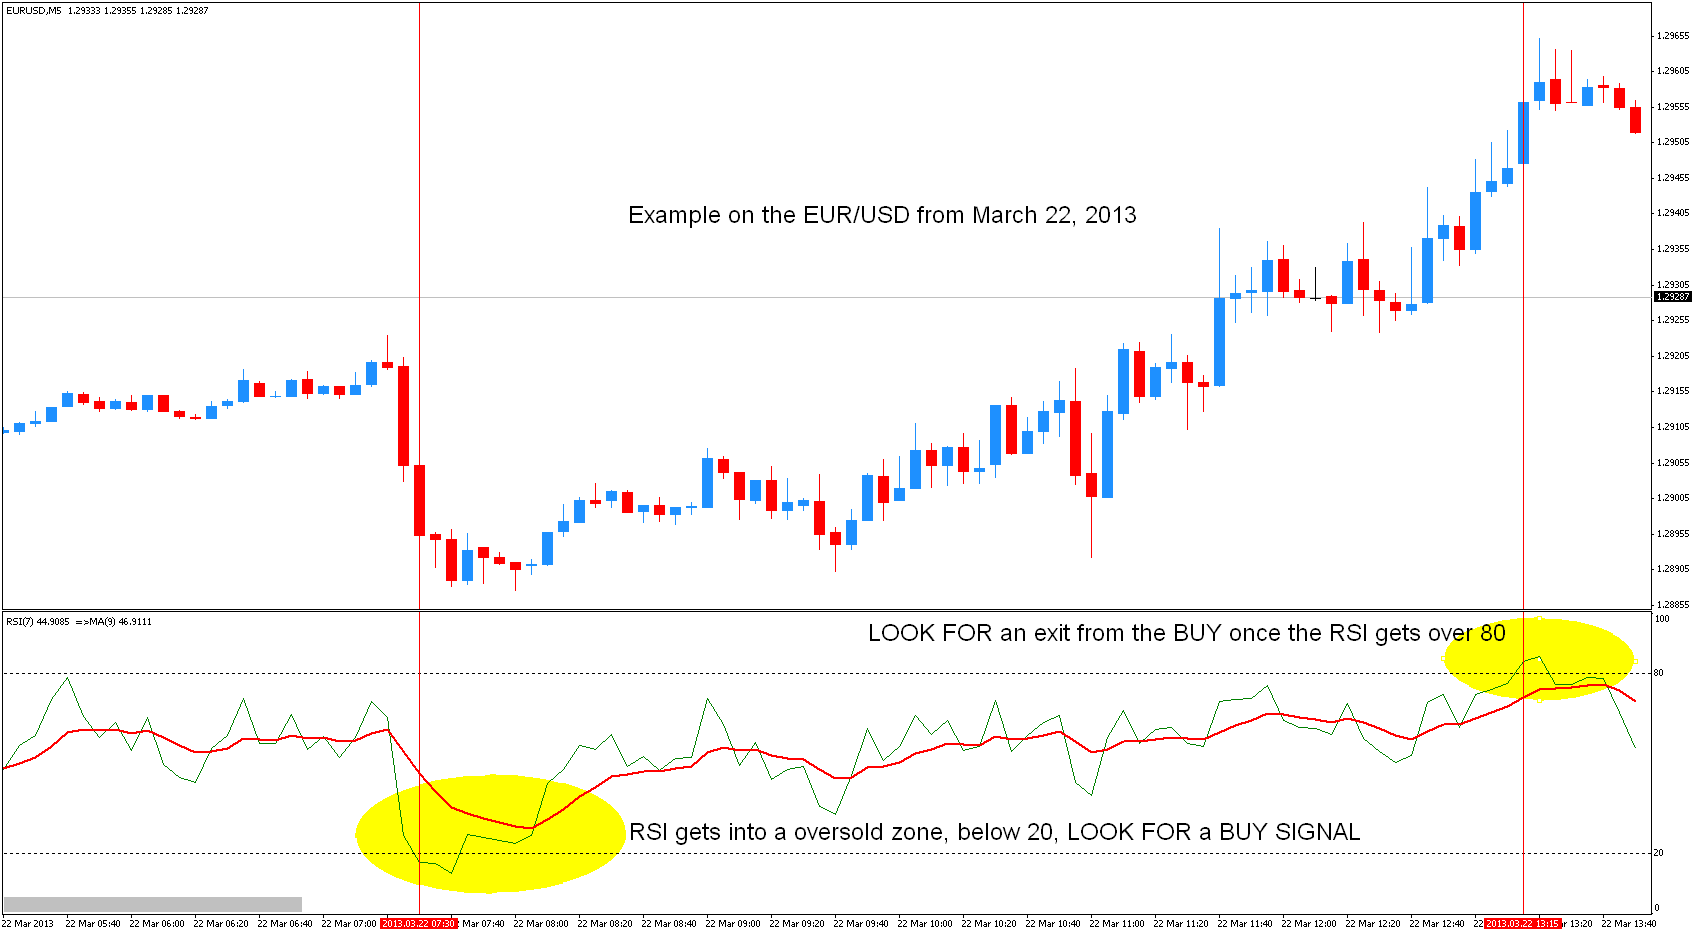
Below is a trade example on the EUR/USD 5-minute chart from March 22, 2013.
The RSI gets below 20 and somewhere in the yellow area that I’ve marked on the chart you should be looking for a buy signal. Depending on where you got in, the entry price would be around 1.2895.
You look for an exit once RSI gets over the 80 level indicating an overbought condition. Again because of the subjectivity of the exit, your exit price would be around 1.2955. The total profit on this trade + 60 pips.
My Thoughts on the RSI System
The vagueness of the entry makes it hard to properly judge the validity of the system. But in general, the idea that this system presents is very old and widely used. The default use of the Relative Strength Index is to look for overbought and oversold market conditions so this system is nothing revolutionary. The more stringent entry conditions of using 80 and 20 as the overbought and oversold levels instead of the usual 70 and 30 should provide less false signals, but this will probably also lead to fewer signals overall.
The smoothing of the RSI with the 9 Period Exponential Moving Average should also provide some way of filtering bad trades, at least, I assume this is the case since the author in the video didn’t expand on the way he uses the Moving Average.
In my opinion, to make this system profitable a great deal of discretion will be needed. Overall something to try if you’re trading the smaller time frame charts like the 5 minute, but not anything groundbreaking.


