This is an addition to an earlier article I wrote on a similar topic called “How to Use the RSI for Intraday Trading” .
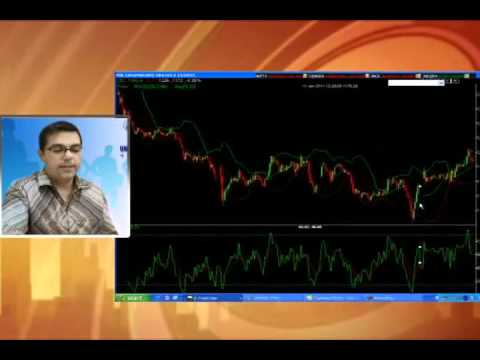
The author of that strategy shares some more info about his intraday system. This time, he adds the Bollinger Bands indicator to the mix. This video is fairly short and like the last one lacks in detail regarding the entry signal.
https://www.youtube.com/watch?v=KUBZQLa7y68
What are Bollinger Bands?
Developed by John Bollinger in the 1980’s, this indicator plots a band two standard deviations away from a simple moving average. The most common MA used for to plot the Bollinger Bands is the 20 Period Moving Average. This is also what the author of the strategy uses.
The Bands can also be used as volatility indicators. When they expand it means that volatility is expanding and the market is probably entering a trending phase. When the Bollinger bands contract the opposite is true, it means there are increased odds for a range bound market.
To learn more check – Bollinger Bands Explained
How do you trade Bollinger Bands?
Different traders use the bands in different ways. Some traders buy when the price hits the lower Bollinger band and sell when the price hits the upper band. Other do the opposite, they sell on a breakout at the lower band and look to buy when price makes a breakout through the upper Bollinger band.
The classical way and the way the trader in the video use the bands are to buy at the lower end and sell at the high end. He looks for confluence or areas where the RSI is entering oversold territory TOGETHER WITH price touching the lower Bollinger Band.
Both of these signals are counter-trend or mean reversion signals. Because price spends only 5% of the time outside of the Bands a trader using this strategy has a high likelihood that the SOME POINT the price will come back inside the Bands.
Plotting the Bollinger Bands in Metatrader 4
Open a 5-minute chart of the EUR/USD currency pair. Now add the Relative Strength Index indicator to the chart as shown in my other article. You can read about how to plot the RSI+Moving Average combo HERE.
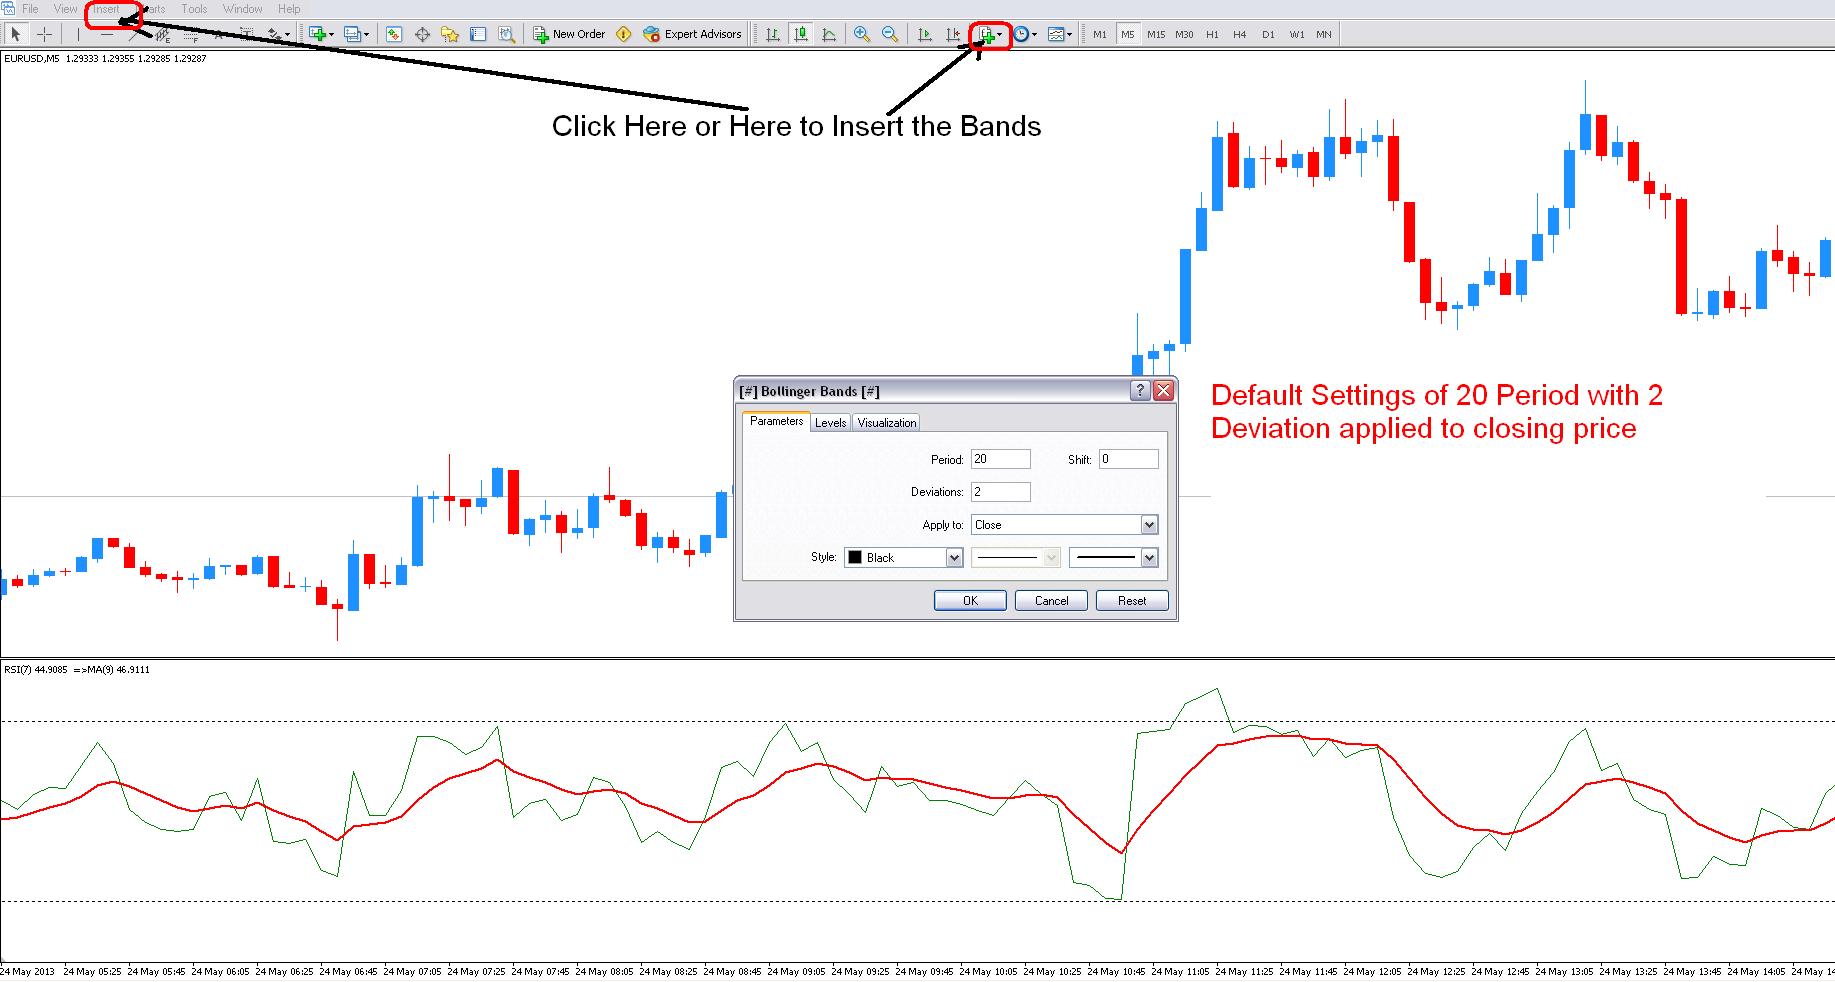
We now add the Bollinger Bands. They are one of the standard indicators included in Metatrader 4. You can find then under Insert > Indicator > Trend. Use the Default Settings of 20 Period with 2 Deviation applied to the closing price as shown on the picture below.
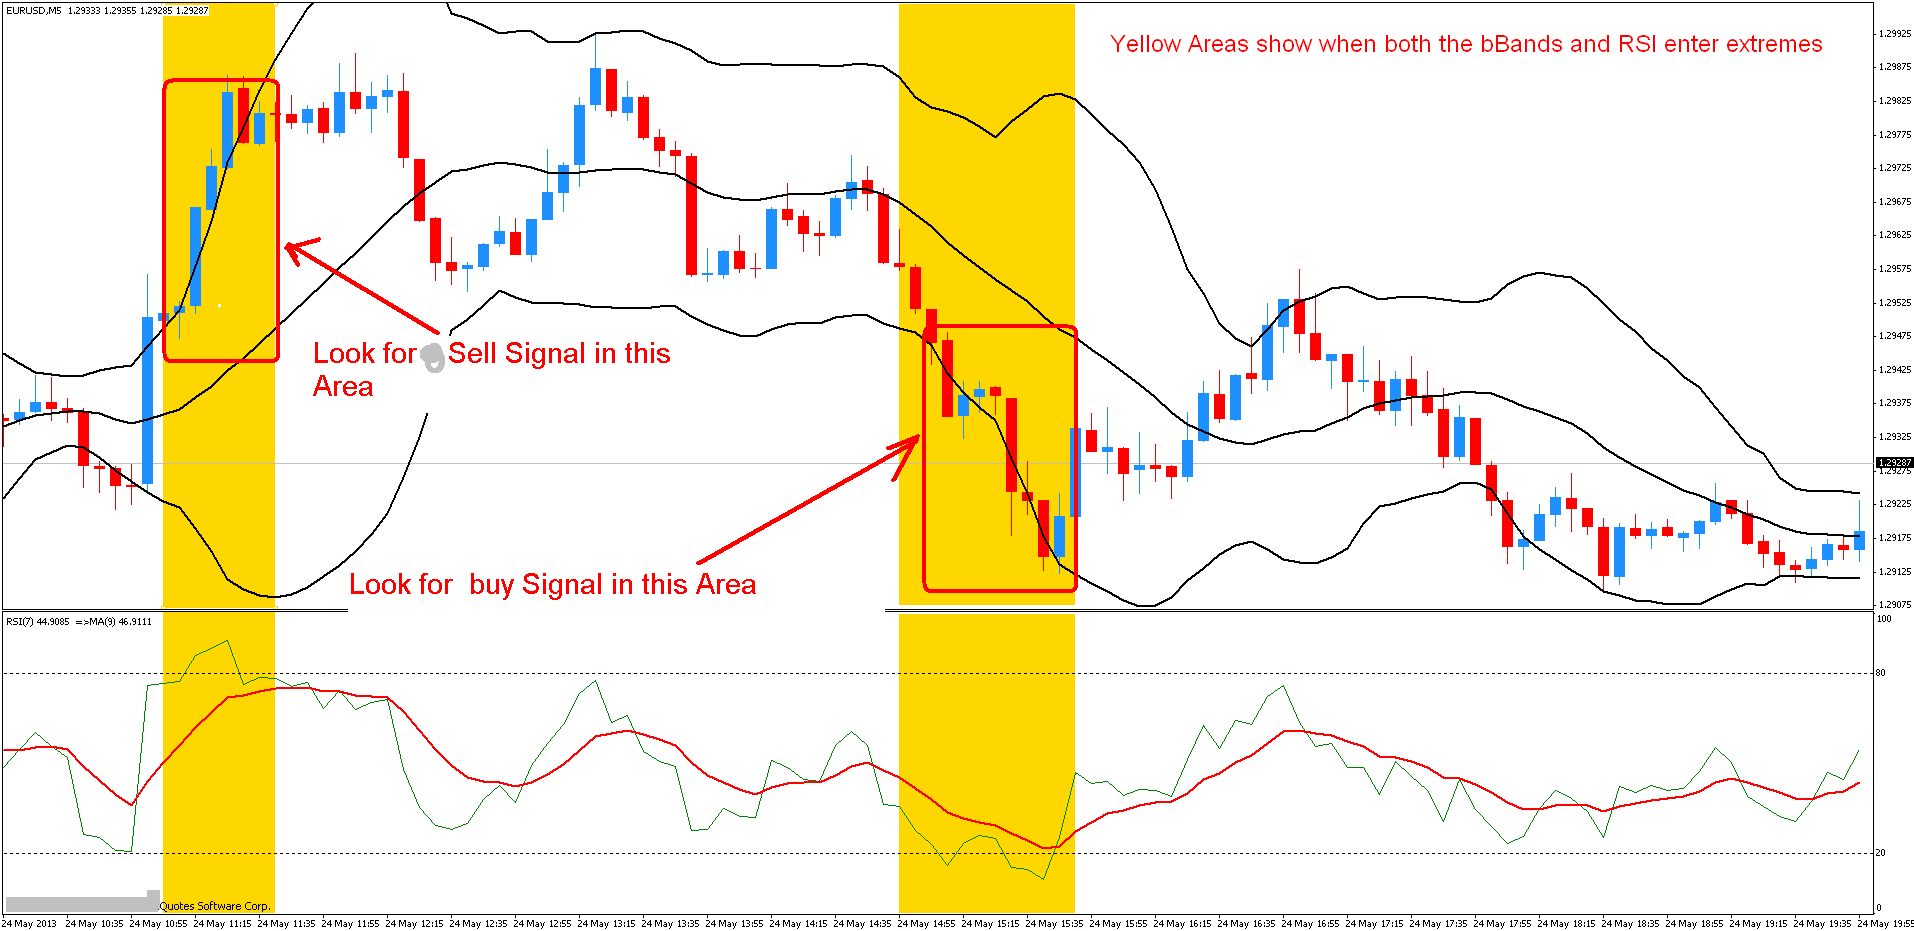
Below is a picture of how this setup looks like. Yellow Areas show periods when both the Bollinger Bands and the RSI enter extremes. The signal to the left shows a period when both indicators entered the overbought territory. The signal on the right shows the same situation in reverse when both indies enter the oversold territory.
Because of this a counter trend system, we would look to sell when price breaks or touches the upper Bollinger Bands AND the RSI is in an oversold territory with a value reading of over 80. In the situation on the right, we’re looking to buy because price made a breakout through the lower band and the RSI value is below 20.
Not Very Impressive, Discretion Needed
The initial impression is not very good as you can see for yourself. While price did eventually reverse and get back inside the Bollinger Bands, on both occasions it did so after going against our position for a long time. If you just entered automatically at every signal of the Bollinger Bands+RSI combo it’s hard to see how you could make a profit over the longer term.
Conclusion: Discretion and trading experience needed for both entries and exits to make this system work.


