- Upbeat data from China and the US is supporting a risk-on sentiment in the market.
- The resulting economic optimism pushes the Japanese yen – a safe haven currency – into the bearish region.
- The 4-hour USD/JPY chart – for Friday London and New York session – shows that price action has turned bearish and has substantial momentum behind it.
Finally, America is building homes again. According to US Census Bureau figures released Friday, US housing starts jumped 19.4% in March to 1.730 million starts (seasonally adjusted annual rate). On a year-to-year basis, the housing starts numbers registered a 37.0% growth in March.
Two main drivers are behind the surge. First, there is more liquidity in the US economy after government efforts to stave off the adverse effects of the coronavirus pandemic. There is more disposable income to free people to acquire new homes. Secondly, the recent trend of working from home has pushed many people to find a permanent base for their work and living. Demand for homes, therefore, should remain strong in the short- to medium-term.
Do not forget that US retail sales also soared nearly 10% in March. For the first time since May last year, bars and restaurants in the US are reporting sales growth in the order of 36% and above.
US and China are Leading the Turn of Events in the Market
Across the Pacific, China recorded the highest GDP growth figures in the world at 18.3% for Q1 2021. The country pulled off a remarkable recovery from the deep recession induced by the public health crisis of Covid-19. Although consensus had converged at 19.2%, the current figures show great potential for China to pull the global economy out of the blues.
Consequently, the market is responding by increasing risk appetite. Interestingly, it seems investors have been anticipating this turn of events because they have been divesting positions in Japanese yen (JPY) and other safe-haven currencies over the past month. For the past month, for instance, the USDJPY pair has declined 0.07% and 0.078 over the past week.
The USD/JPY price action is telling in terms of fluctuations in market sentiment. Since mid-March, the market has been pricing in a substantial recovery in economic activity in China and the US, and globally. However, the selling pressure seems to have hit the pair harder in the week just ended, as the figure below attests.
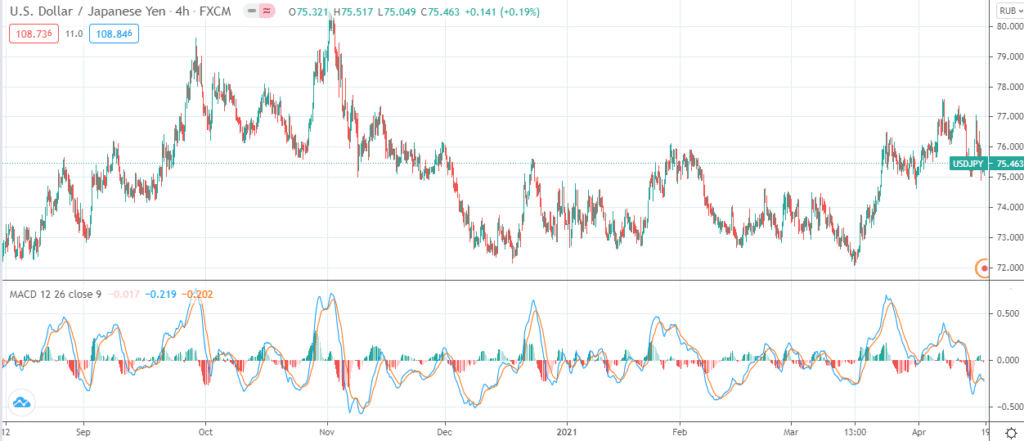
Figure 1: USD/JPY 4-hour chart for Friday
Disappointing Data in Canada and Britain Holding Back the Loonie and the Sterling
In the north of the US, wholesale sales figures are going south, at least for February. The latest data from Statistics Canada indicates wholesale sales declined 0.7% to a little over C$68.76 billion for February. More worryingly, this is the second time in three months that Canadian wholesale sales are declining.
USD/CAD was down to 1.2517 (a difference of 0.22%) right before the New York session, which is also a 0.91% drop from this week’s peak. The pair’s price action on a 4-hour chart is on the downside of both the 20-day and 50-day EMA.
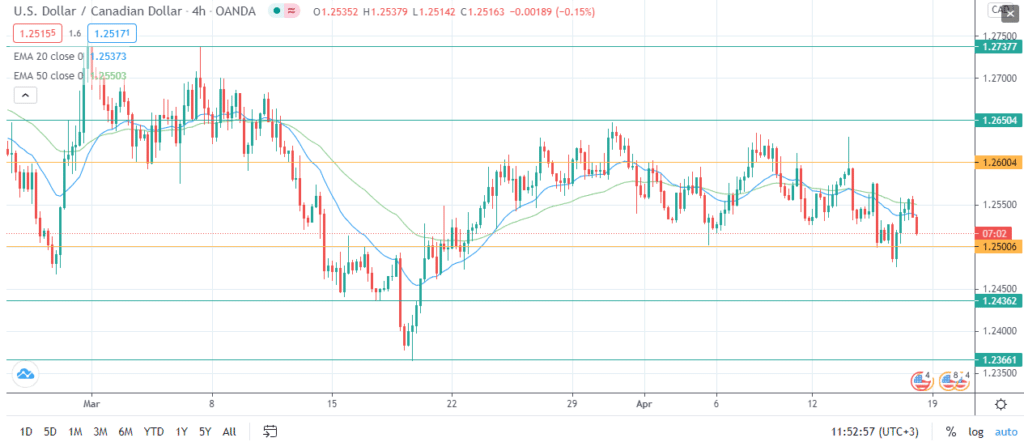
Figure 2: USD/CAD 4-hour chart
Britain is just coming out of one of Europe’s strictest lockdowns, and there is pure joy in the air. However, this is not the case in the forex market because the sterling is sweating against the greenback. The reality is that the US economy is on a roll, and the UK cannot catch up. Stimulus checks in American’s pockets buoy the greenback, although the sterling is not doing that bad.
At press time, the 4-hour GBP/USD chart showed some return of strength to the sterling. The MACD indicates the buying pressure is mounting, although the question of whether the pound can sustain the momentum still lingers.
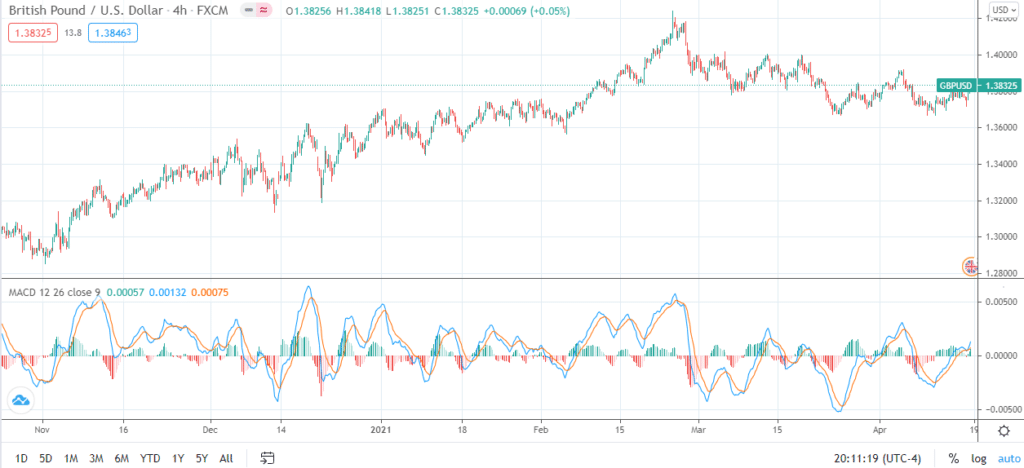
Figure 3: GBP/USD 4-hour chart


