Crossovers are an essential part of forex trading because they provide signals on when a trend is ending, or a reversal is about to happen. In this article, we will look at what these crossovers are and how to incorporate them in your day trading.
Moving average crossover
The moving average is an important technical indicator that compares the current market price of a forex pair and where it has been in a certain period. For example, the 14-day simple moving average (SMA) is plotted to show the average price where the price has been in the past 14 days. Therefore, if there is a major deviation, it can tell you whether the currency is getting overvalued or undervalued.
The moving average crossover is a popular strategy used to identify these reversals. The most popular of these are the golden and death crosses. The golden cross happens when the 50-day moving average crosses the 200-day moving average in a bullish manner, as shown in the chart below. The death cross, on the other hand, happens when the two averages make a bearish crossover.
Golden cross example
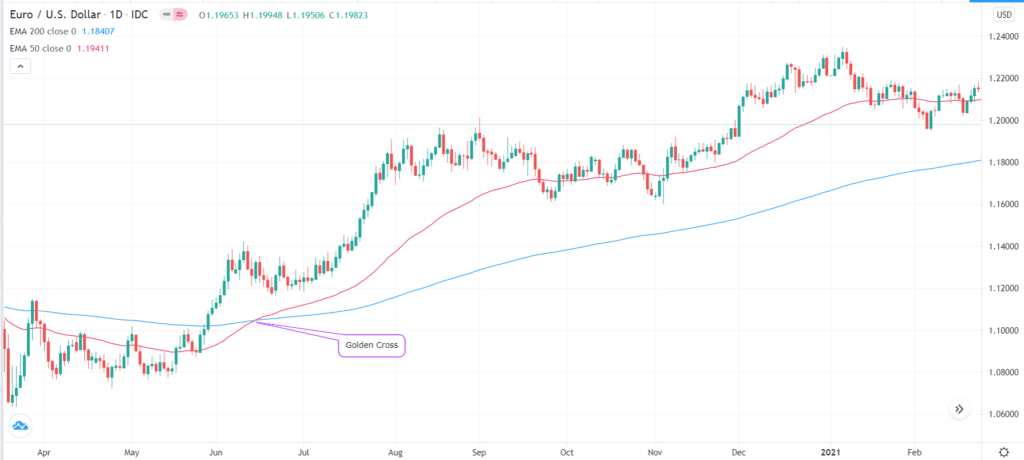
The idea behind these crosses is relatively easy. In a golden cross, when the price starts to recover, it hits the 50-day moving average first as bulls gain the momentum. This bullish trend is typically confirmed when the price moves above the 200-day moving average.
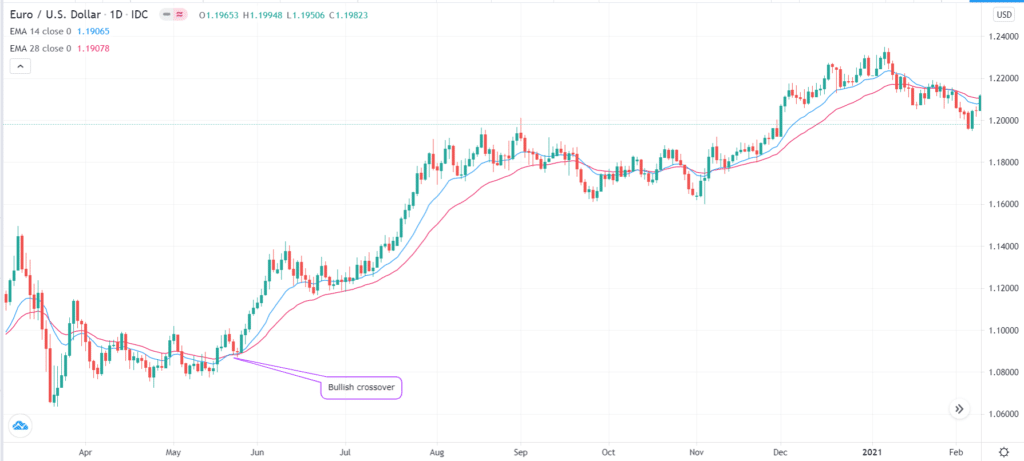
These crosses, however, are ideal for long-term traders who buy and hold positions for a long period. For day traders and swing traders, the two averages tend to be ineffective. Therefore, most of them use relatively short moving averages. The most popular of these is a two-week and a four-week moving average.
As you can see below, these averages tend to capture reversals faster than the 50-day and 200-day averages.
Shorter and medium MA crossovers
There is no generally accepted period when using these crossovers. Therefore, as a day trader, you need to take time and test several averages to see the crossover that works best for your trading strategy.
Further, you should consider the type of moving average that you will use consistently. The simple moving average is the most basic and the most common. However, many day traders prefer other types of moving averages as the exponential, smoothed, and Hull.
After buying a moving average crossover, traders continue holding the position so long as the price is above the two averages. The selling signals start to emerge when the price moves below the short MA. The signal is confirmed when the price moves below the longer MA.
MACD Crossover
Another popular approach of day trading crossovers is to use the moving average convergence divergence (MACD) indicator. As the name suggests, this is an oscillator that is derived from fast and slow-moving averages.
It is calculated by subtracting a longer moving average from a short MA. In most cases, the most popular periods are 26 and 12 MAs. After this, a smoothing MA, usually a 9-period average, is then plotted.
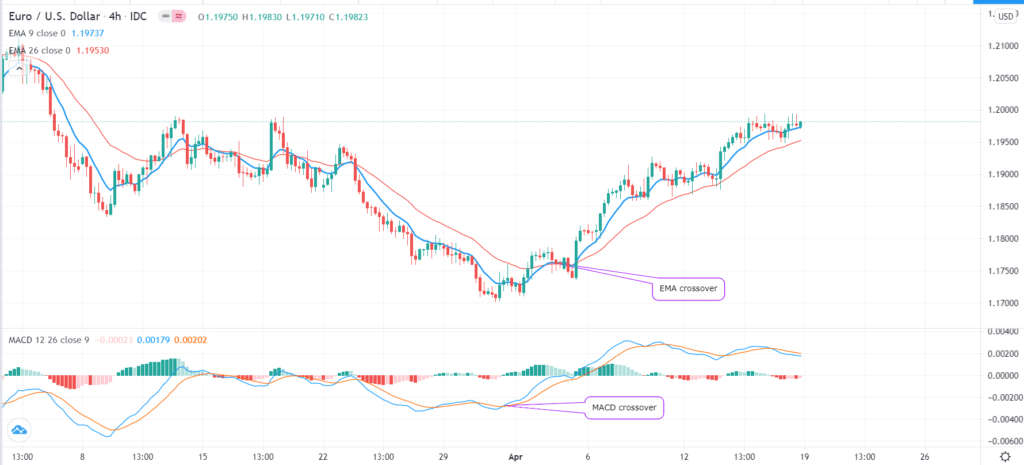
A MACD crossover is a relatively simple trading strategy that looks at when and where the MACD and the crossover lines make a crossover. If it happens significantly below the neutral line, it is a bullish signal that implies that the price will start rising. Similarly, if the crossover happens extremely above the neutral line, it is a sign that the reversal is happening.
In case of a bullish crossover, traders will buy the currency pair and hold it until a bearish crossover happens. The strength of this bullish crossover is confirmed when the two lines move above the neutral line and continue rising.
Most day traders also combine the MACD crossover with the moving average crossover that we looked at above. They use the two as a way of confirming or validating that a new trend is about to form. An example of this is shown below.
MACD crossover example
Stochastic Oscillator crossover
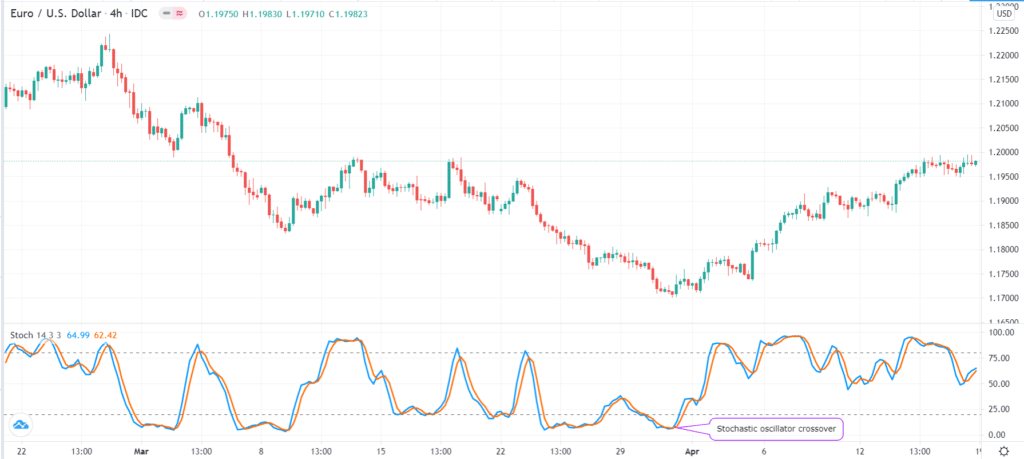
The next popular strategy for trading forex crossovers is using the Stochastic oscillator. This is a popular indicator that is made up of the %D and %K lines. In most cases, the default for the %D is 14 while %K is 3. These are then smoothed by the 3-period moving average. These two lines usually move up and down, mostly following the price.
Therefore, buying signals happen when the %D and %K lines make a crossover below 20, which is the default oversold level. A sell signal, on the other hand, comes up when the two lines crossover above the overbought level of 80.
A good way of confirming these crossovers is to combine the Stochastic oscillator with other technical indicators. For example, you can combine it with the moving average and the MACD crossover that we have explained above.
Stochastic oscillator crossover
Ichimoku Kinko Hyo crossover
At first, the Ichimoku Kinko Hyo is a scary-looking indicator. Yet, for experienced traders, it is one of the easiest one to use. Without getting into details, the indicator is made up of a conversion line, baseline, lagging span, lead 1 and lead 2, and two clouds.
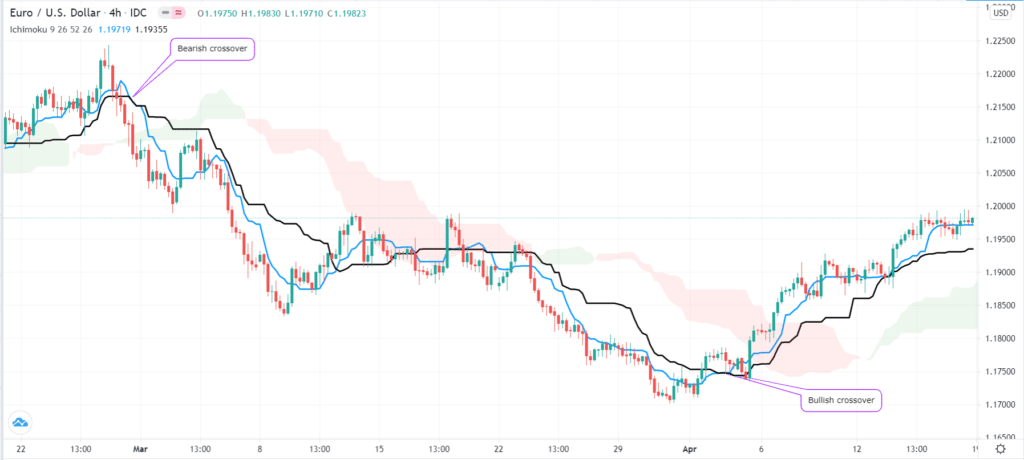
There are several ways of using the Ichimoku crossover strategy, but the most popular one is to look at areas where the conversion line (blue) and baseline (black) make a crossover. If it happens in a bearish trend, it usually sends a signal that the price may be starting a new bullish trend. This is further confirmed if it manages to move above the Ichimoku cloud.
Similarly, when the crossover happens in a bullish trend, it usually sends a signal that a new bearish trend is starting to form, as shown below.
Ichimoku crossover example
Final thoughts
Day trading crossovers is an important and popular strategy that is widely used because it works. In this article, we have looked at several strategies for using these crossovers. We have also looked at the best technical indicators to use when using the strategy. If you are new to crossovers, we recommend that you spend time learning and experimenting more about them.


