ForexEzy
No Result
View All Result
  • Top Forex Advisors
    • Best Forex Robots
    • Best Forex Signals
    • Best Managed Accounts
  • Top Forex Brokers
    • Best Forex Brokers
    • US Forex Brokers
    • UK Forex Brokers
    • MT4 Forex Brokers
    • MT5 Forex Brokers
    • Zero Spread Brokers
    • Best PayPal Brokers
    • TradingView Brokers
    • Social Trading Platforms
  • Top Review Platforms
  • Forex Education
    • Getting Started
    • Forex Basics
    • Forex Trading Strategies
    • Money Management
    • Risk Management
    • Technical Analysis
    • Fundamental Analysis
    • Trading Psychology
    • Social Trading
    • Automated Trading
  • Forex Tools
    • Forex Robots
    • Forex Indicators
    • Forex Signals
    • Forex VPS
  • Forex Forecast
  • Crypto
    • Best Crypto Exchanges
    • Best Crypto Bots
    • Crypto Guides & Forecasts
No Result
View All Result
ForexEzy
No Result
View All Result
The World’s Leading Social Trading Platform
Try now
Home Forex Education Technical Analysis

The Trading Indicator You Have not Heard of – The Williams %R

by Adam Stanley
December 1, 2020
in Technical Analysis
0
The Trading Indicator You Have not Heard of – The Williams %R
0
SHARES
11
VIEWS
Share on FacebookShare on Twitter

The Williams Percentage Range is a highly effective tool that measures price variations over a period of time for various assets. Read further to understand what it is and how you can use it to trade better. 

What is the Williams Percentage Range?

The Williams Percentage Range, or the %R, is a type of momentum indicator used for the analysis of the market behavior. Any indicator that takes price fluctuations into account is a momentum indicator that measures the variations in the pricing mechanism over a given period of time. The Williams %R measures the relationship between the latest closing price and the previously observed high and low prices. 

Mostly finding its use in the forex market, it is also an accurate estimate for overbought or oversold currencies.  Any currency is regarded as oversold when it appears at a price below its fair price, and such currencies are considered undervalued in the market. It is regarded as overbought when it appears at a price above or higher than its fair price. Such currencies are considered to be overvalued.

The Williams %R can be used to check for the strength of various trends. The values represented by the indicator help traders find entry and exit points in a trend. 

the Williams %R denotes a value of -69.63 for a look-back period of 14-period

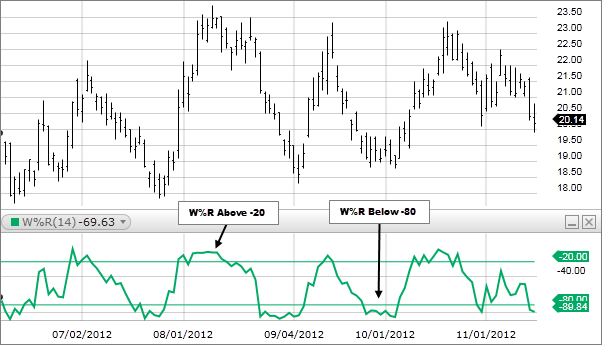
Here, the Williams %R denotes a value of -69.63 for a look-back period of 14-periods. The values crossing -20 and -80 are registered for overvalued or undervalued stocks. -69.63 is closer to the oversold range for an asset. 

Note that the indicator only uses price change as a variable; it does not take volume into account. The Williams %R only measures the rate of price fluctuations and not the direction of the movement. This is why traders always prefer to use it in combination with volume and directional indicators. 

The Best Forex Robots Report Is Already Here!
best forex robots
Check out 30+ best expert advisors with daily updated live results and statistics
Click Here

How do you use it?

It is a bound oscillator as it functions between a band of two extreme values. The range of the Williams %R stretches from 0 to -100. The values of 0 to -20 are a signal for overbought stocks, whereas the values between -80 and -100 are signals for oversold stocks. 

Calculation

The default time period for the indicator is 14 periods. These can be days, weeks, or months, etc. Traders can customize this time period based on their trading objectives. The time period also affects the sensitivity of the indicator. 

 The Williams percentage range is calculated as follows: 

 The Williams percentage range

To calculate the Williams %R, follow the steps below: 

  1. Record the high and low prices for the 14-period. 
  2. On the day of the last period, check for the highest value out of all the high prices recorded. Check for the lowest price in the same manner. 
  3. Determine the current price at the close of the 14-period. 
  4. Enter these values into the formula to generate the %R. 

Once you have a decimal, you can proceed to multiply it by -100 to correct to get the inverse in the %R and use the alternative formula:

The Williams percentage range formula

Understanding the values

In the case of overbought stocks between the upper ranges, the current closing price is near the lowest low price and far from the highest high price recorded during the 14-period. When the stocks are oversold between the value of -80 and below, the value of the current closing price is near the highest high price and far from the lowest low price recorded during the 14-period. 

As the indicator moves towards 0, it is a signal for the start of an uptrend. When it moves towards -100, it is a signal for the beginning of a downtrend. The value of 050 is the midpoint in the %R. It indicates that the prices are equally far apart from the highest high and the lowest low. 

Sometimes, the indicator is known to generate false signals such that the values denoted by the indicator do not align with the price changes. This can be caused by a smaller look-back period. For example, when you take a look-back for 14-periods, the values of high and low prices can be affected by prices taken before the 14-periods. This can lead to anomalies in the indicator functioning. 

Relationship between the Williams %R and the Stochastic Oscillator 

The working of the Williams %R is in direct contrast with that of the Stochastic Oscillator. While the Williams %R represents the relationship between the highest high price observed over the 14-periods and the current closing price, SO measures the relationship between the lowest low price observed over the 14-period and the current closing price.

The %K line derived using a stochastic oscillator is the exact inverse of the %R line derived from the Williams %R indicator and is more sensitive to price fluctuations as compared to the SO. 

Final Thoughts

The Williams percentage range is a highly potent technical indicator used for market analysis. Traders can use it with a combination of other technical tools to generate an elaborate picture of the market. Despite functioning inversely to the stochastic oscillator, the Williams %R is capable of developing the same values when inverse. It is an effective indicator that can be used to verify trends, but it does not give much information about trend reversals. Traders also need to be wary of false signals that might be generated by the indicator. 

Ultimately, traders need to rely on proper risk management and thorough market study along with technical indicators to understand the market better. 

The Best Forex Robots Report Is Already Here!
best forex robots
Check out 30+ best expert advisors with daily updated live results and statistics
Click Here
ShareTweet
Previous Post

How to Start Professional Forex Trading Floor

Next Post

FX Classic Trader Review

Related Posts

Trading With Balance of Power Indicator

Trading With Balance of Power Indicator

by Adam Stanley
December 9, 2021
0

The Balance of Power (BOP) indicator is an analysis tool created by Igor Livshin in August 2001. It tracks the...

What Are Pennant Chart Patterns in Forex: Step by Step Guide

What Are Pennant Chart Patterns in Forex: Step by Step Guide

by Chintan Patel
November 15, 2021
0

Continuation patterns in the forex market are a common occurrence whenever there is a large movement in one direction followed...

How To Trade Ascending Scallops in Forex

How To Trade Ascending Scallops in Forex

by Adam Stanley
November 10, 2021
0

Price in the Forex market does not always move in one direction. After a significant move in one direction, up...

Inverted Scallops in Forex Chart Patterns: Step by Step Guide

Inverted Scallops in Forex Chart Patterns: Step by Step Guide

by Adam Stanley
November 9, 2021
0

Whenever prices move up significantly in the forex market, exhaustion often kicks in. In most cases, the fatigue is usually...

Elder’s Method in Forex Trading

Elder’s Method in Forex Trading

by Tim Baudin
November 3, 2021
0

There are several strategies that traders and analysts have developed over the years, all in a bid to milk the...

Load More

Leave a Reply Cancel reply

Your email address will not be published. Required fields are marked *

Best Forex Automated Systems

  • TechBerry 9/10
  • Happy Galaxy 8.5/10
  • Forex Cyborg 8.5/10
  • Forex Fury 8/10
  • FXgoodway 7.5/10
  • Best Forex Brokers
  • Best Forex Robots
  • Best Forex Signals
  • Best Forex Managed Accounts

Top Trading Markets

We are dedicated to demystify the world of forex trading for you – no matter what level you are on.

Categories
  • Automated Trading
  • Crypto Robot Review
  • Cryptocurrency Trading
  • Day Trading
  • Forex Basics
  • Forex Brokers
  • Forex Education
  • Forex Forecasts
  • Forex Indicators
  • Forex Market Commentary
  • Forex Robots
  • Forex Signals
  • Forex Signals
  • Forex Tools
  • Forex Trading Strategies
  • Forex VPS
  • Fundamental Analysis
  • Managed Accounts
  • Money Management
  • News
  • Review
  • Review Platforms
  • Risk Management
  • Social Trading
  • Technical Analysis
  • Top World Traders
  • Trading Apps
  • Trading Psychology
  • Uncategorized
Tags
Acquisition AI Amazon Apple Artificial Intelligence Bitcoin bond yields CEO China earnings earnings report economy Electric Vehicles Federal Reserve financial performance Financial Results forex ea forex software reviews Growth Guidance Housing Market inflation interest rates Investing investment Investors Market Volatility merger mortgage rates net profit Nvidia Oil prices Q2 Results revenue Revenue Growth Sales sales growth Stock Futures stock market stock performance Stocks strategies technology Tesla Video
  • Terms of Use
  • Privacy Policy
  • Compensation Disclosure
  • Risk Disclosure
  • About Us
  • Contact Us

Copyright © 2023 by ForexEzy.com

No Result
View All Result
  • Top Forex Advisors
    • Best Forex Robots
    • Best Forex Signals
    • Best Managed Accounts
  • Top Forex Brokers
    • Best Forex Brokers
    • US Forex Brokers
    • UK Forex Brokers
    • MT4 Forex Brokers
    • MT5 Forex Brokers
    • Zero Spread Brokers
    • Best PayPal Brokers
    • TradingView Brokers
    • Social Trading Platforms
  • Top Review Platforms
  • Forex Education
    • Getting Started
    • Forex Basics
    • Forex Trading Strategies
    • Money Management
    • Risk Management
    • Technical Analysis
    • Fundamental Analysis
    • Trading Psychology
    • Social Trading
    • Automated Trading
  • Forex Tools
    • Forex Robots
    • Forex Indicators
    • Forex Signals
    • Forex VPS
  • Forex Forecast
  • Crypto
    • Best Crypto Exchanges
    • Best Crypto Bots
    • Crypto Guides & Forecasts

© 2023, Forexezy. {copy} {year}