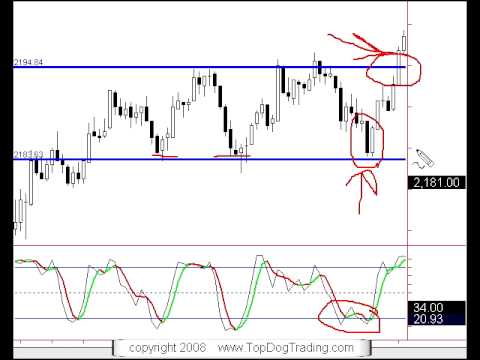
The video linked below deals with trading breakouts and how to get in a breakout trade early. Trading breakouts can be one of the most frustrating experiences for traders and especially for newer traders. Price will often break a previous high by just a few pips only to fall back into the range. How do you avoid this?
What market to trade? What timeframe?
Trading breakouts will work on any market that is liquid. It will also work on any timeframe starting from daily to weekly monthly or even intraday. But of course, the lower you go down in timeframes the more transactions costs will cut into your profits. Trading breakouts work for swing trading as well as short-term trading.
Example in Forex
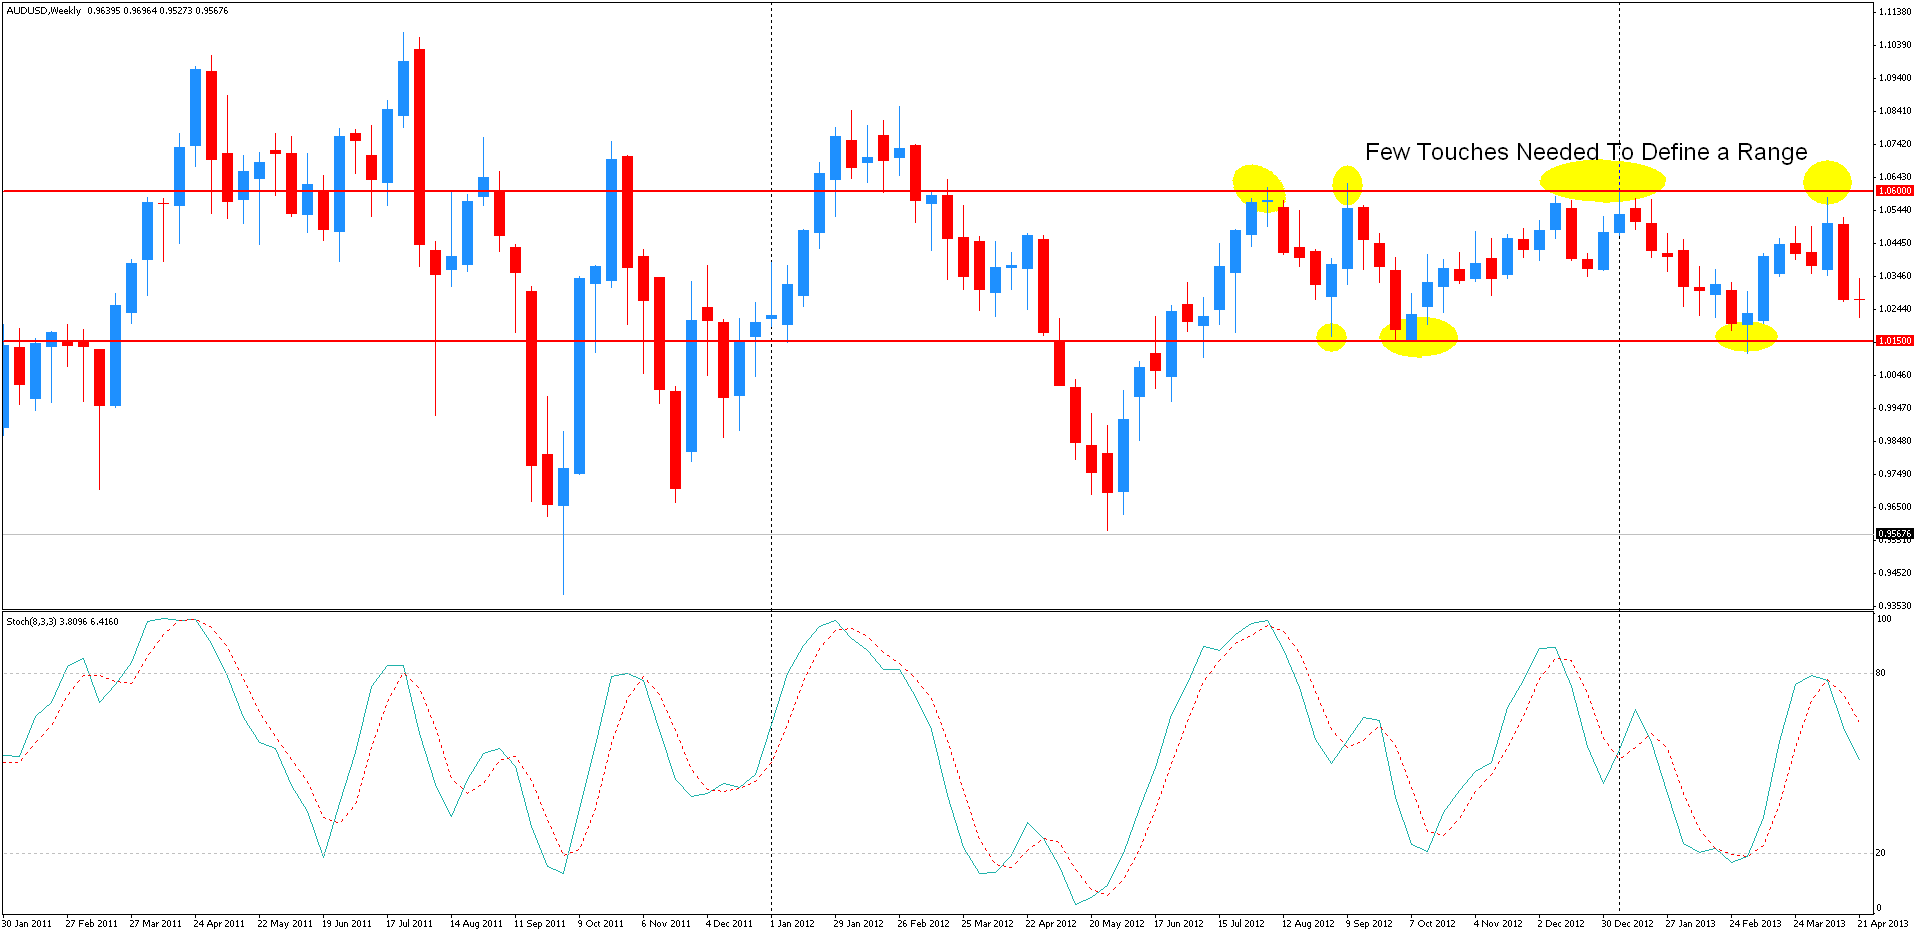
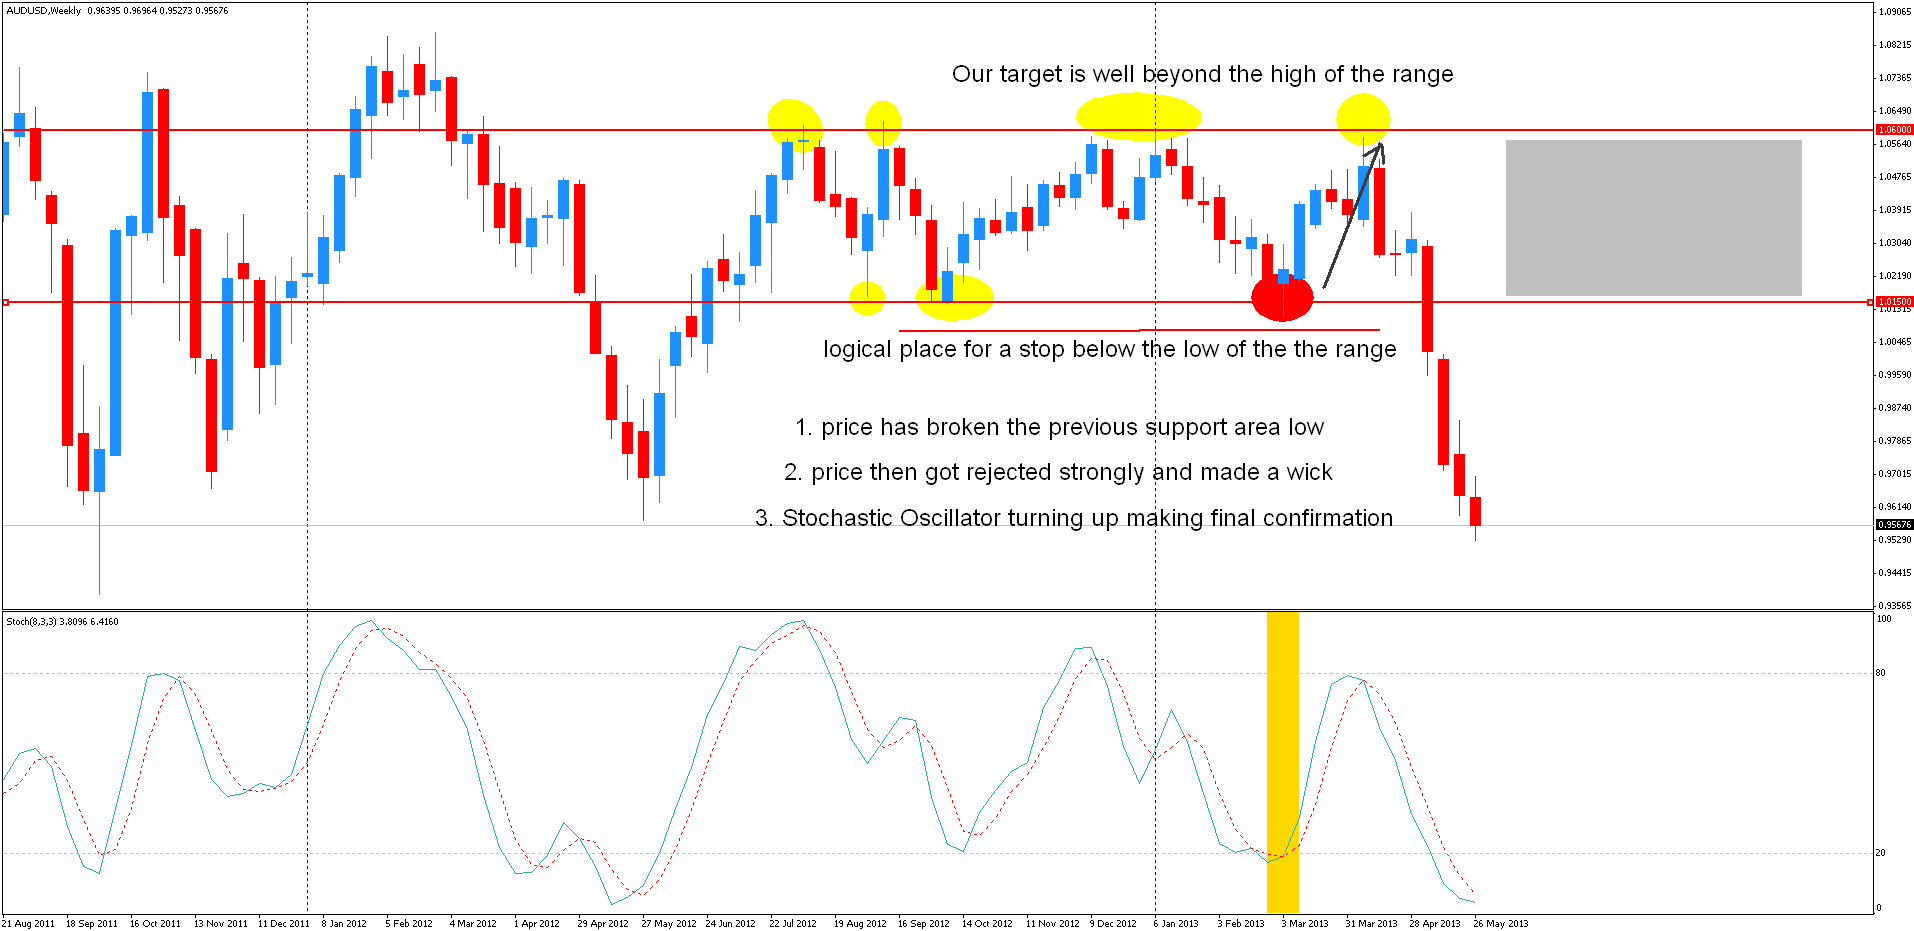
The chart below shows my implementation of the author’s system in the forex market.
The picture shows a recent example of the AUD/USD currency pair. This is a weekly chart. We can see the pair swing back and forth between the 1.0150 and the 1.0600 level a few times. A few touches (at least two) are needed to define a trading channel. The more price swings back and forth, the more the odds increase for a breakout.
Get in Before the Crowd by Buying Low / Selling High
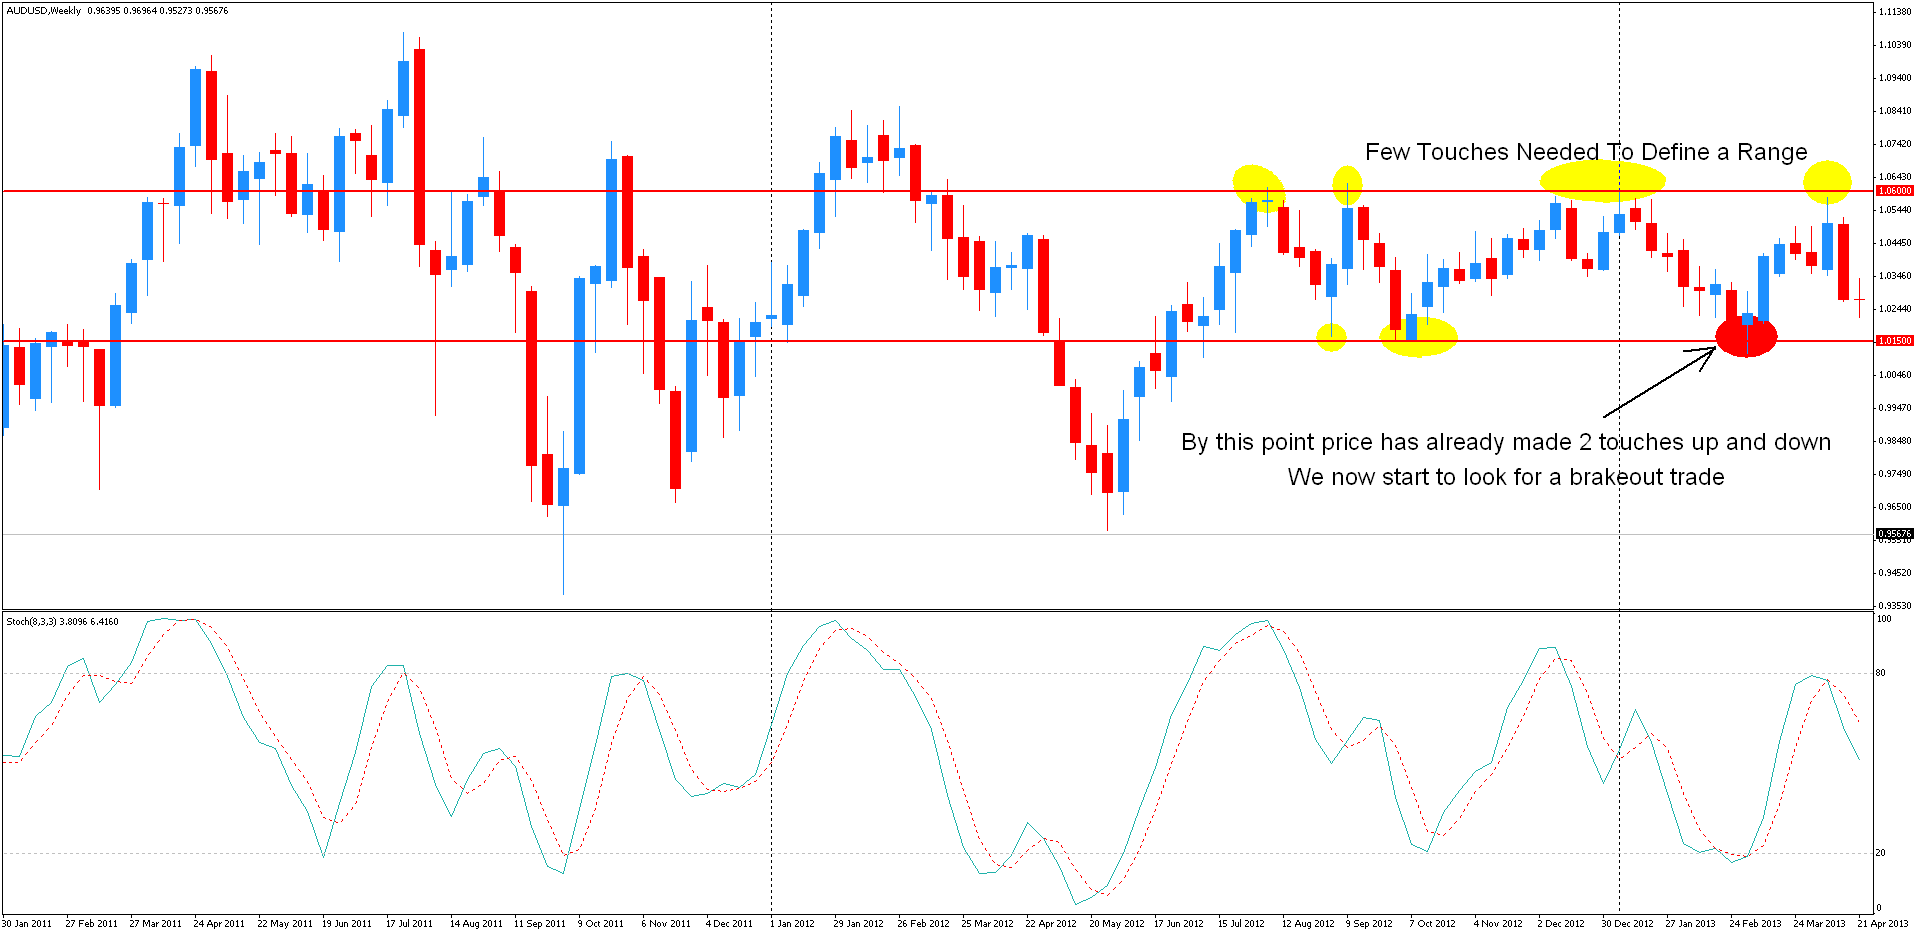
Look at the red circle on the chart below. By this point price has already made 2 touches both up and down making a trading range. We’ now start to look for a breakout trade.
Most traders would buy when price breaks the top of the trading channel and sell when price breaks the low end of the range. This system uses an opposite entry technique, it buys low and sells high.
Three Entry Criteria – Testing Previous Area, Price Action, Stochastic and Higher Timeframe
We use 3 different entry criteria to helps us enter a trade. The first price needs to be testing a previous area of support or resistance. Next, the price action shown at this level has to be favorable and the stochastic indicator has to confirm the direction of the price. The final criterion is a look at a higher timeframe, we would want to see this timeframe chart show confirmation of our trade bias.
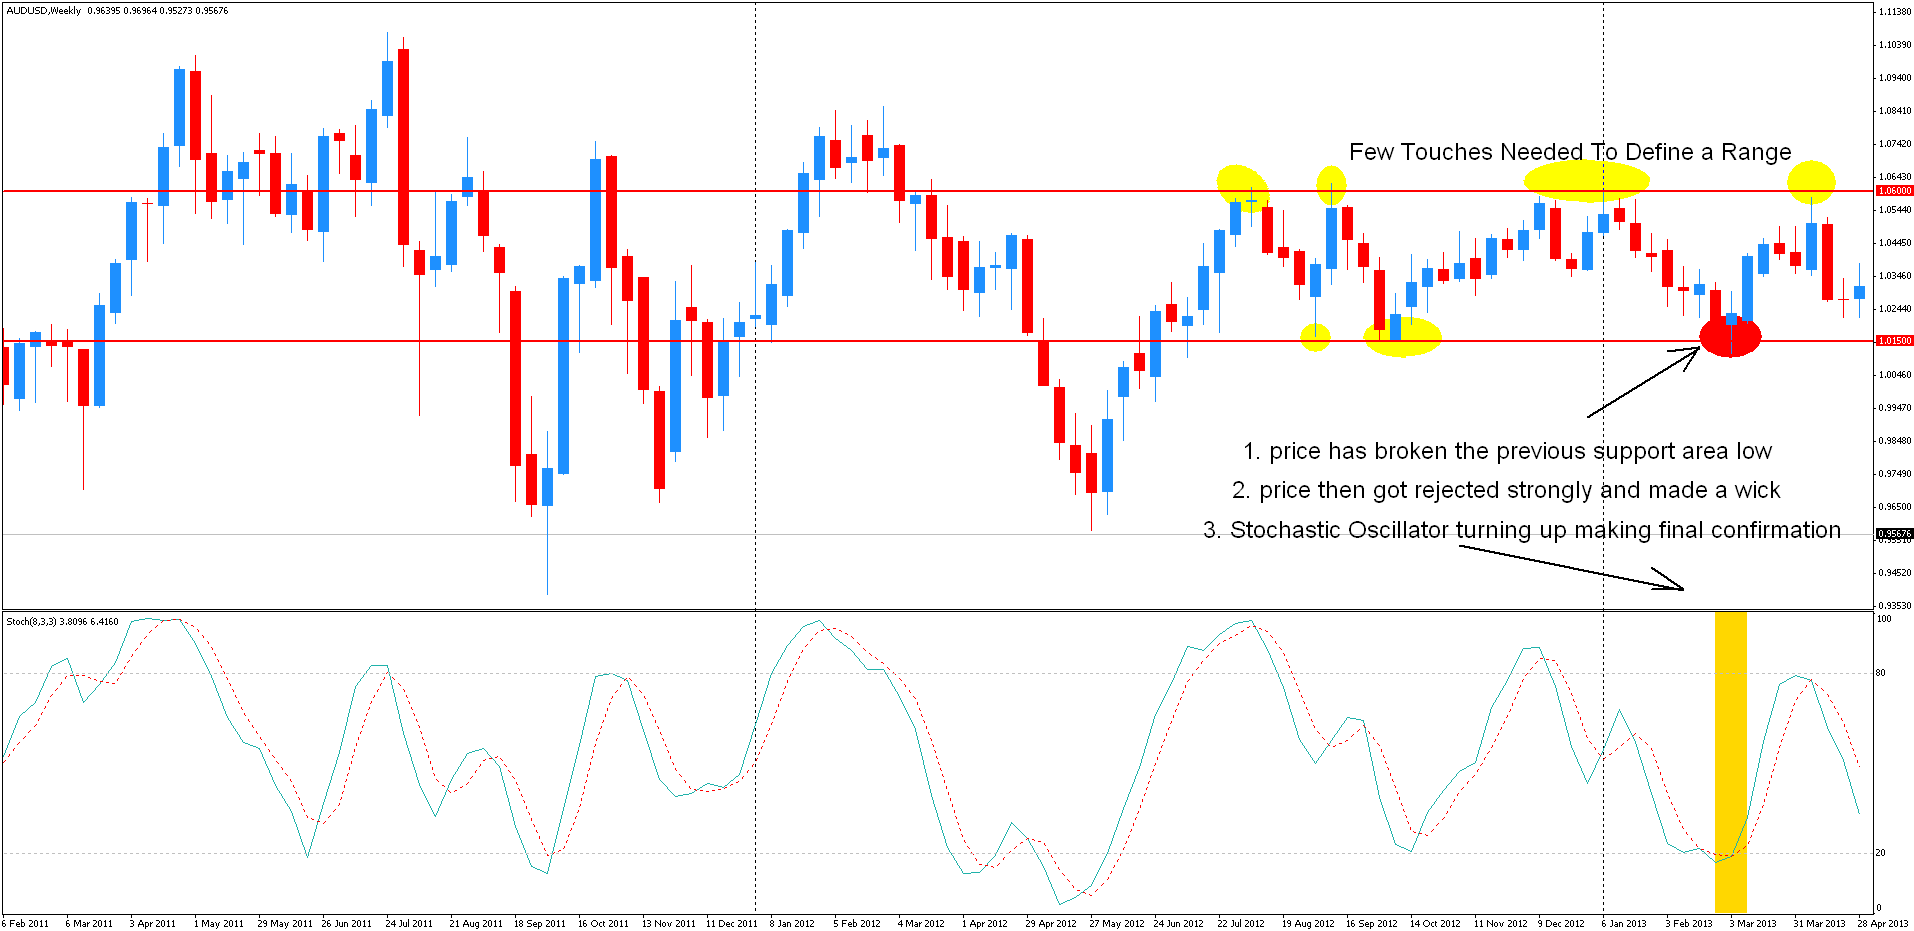
In the chart below we’re looking at a recent trade example that happened on the AUD/USD weekly chart on March 8, 2013.
At the red circle shown on the chart, price has broken the previous support area low by a small amount and then got rejected strongly and made a wick, a sign of a possible reversal. This satisfies the first 2 entry criteria. We then look at the Stochastic Oscillator for clues. We can see that it is also turning up making another final confirmation of the trade.
Trade Management – Entry, Stop Loss and Take Profit
The entry price of the trade is at 1.0235. A logical place for a stop would be just below the low of the trading range. Our target is well beyond the high of the range as we’re in for the breakout trade.
As the trade moved in profit a trailing stop is employed to protect the gains and limit the loss. We can see that our example above didn’t turn into a huge winning breakout trade. But if we employed a protective trailing stop we would still get some pips out of this move.


