- China has been the greatest beneficiary of the US-China trade war.
- Reduced consumption in China will lower economic output into 2021.
- A higher US CPI indicates strengthening the economy post-pandemic.
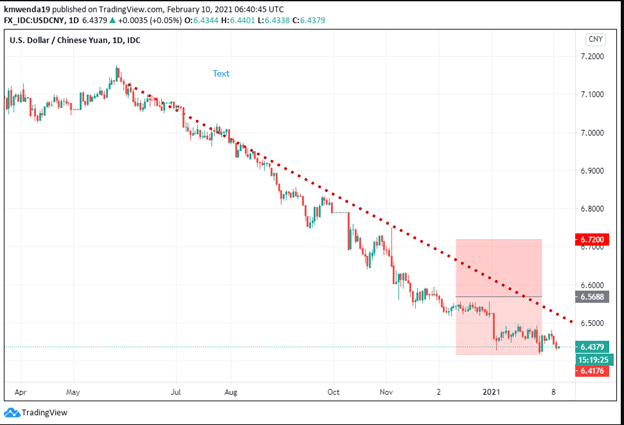
The US dollar has lost 1.35% year-to-date (YTD) against the Chinese Yuan to settle at 6.4383 on February 10, 2021. The US-China trade war has favored the yuan, with the latter rising 9.64% against the dollar from 2016 to 2018. Biden’s administration will work to renew the targets set in the phase-one trade deal entered into force in January 2020. Reports indicate that China only fulfilled 58% of the commitment. The People’s Bank of China (PBOC) also lowered the reference of the USD/CNY trading pair by 0.22% on February 10, 2021, as a sign that the yuan’s strength against the dollar is perpetuating.
US-China Phase 1 trade deal
China agreed to import goods and services worth $200 billion in the financial year 2020-2021. China’s purchase into 2021 fell short of 42%. The worst affected sectors included agricultural exports (especially soybeans and lobsters) and energy products.
There was a notable increase in the sale of semiconductors and their manufacturing equipment by 27%. This gain was attributed to stockpiling from companies such as Huawei Technologies due to the export ban based on national security concerns. As of 2019, the US-China trade deficit stood at $308.8 billion.
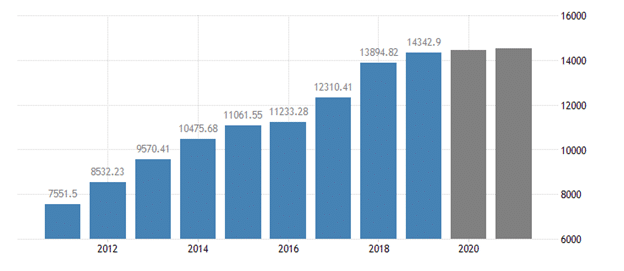
China’s GDP has risen by 68.10% since 2012, driven by large-scale capital (both domestic and foreign) investments and savings.

China’s GDP stood at $14 trillion in 2019, $7 trillion short of overtaking the US GDP that is the world’s largest at $21 trillion. The Asian powerhouse reported a 2.3% in the GDP in 2020 even as the world struggled to fight off the coronavirus pandemic. The rise was fueled by a 14.8% increase in online sales of basic consumer goods in 2020. The country is working to increase the domestic demand of products as the main economic driver rather than investments.
China’s consumer price index (CPI) YoY decreased by 0.3% from the projected 0.1% decline into the first quarter of 2021. The producer price index (PPP) also fell by 0.1% to stand at 0.3% (MoM) from a projection of 0.4%, indicating a bearish run for the yuan. The increasing costs of commodities drove up the PPI, signaling an unbalanced recovery of the Chinese economy in the first quarter of 2021.
Production in China increased to $155 billion in the Lunar New Year, with the economic output slated to shrink 0.5% due to reduced consumption. Industrial production in December 2020 rose by 7.3% (YoY), supported by steady manufacturing and robust energy demand.

The decline in PPI indicates that China’s retail sales may start to increase at the retail stage.

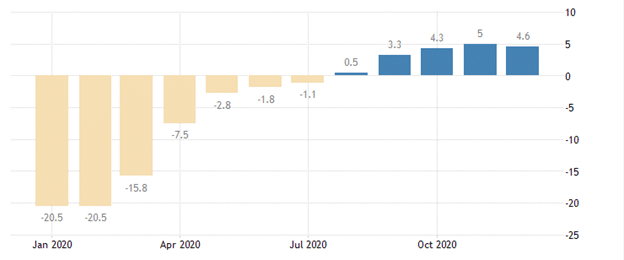
Trade in retail products decreased by 0.4% in December 2020 to stand at 4.6% from a 5% growth in November 2020. The sale of oil and its products fell by 3.8% as opposed to the gain in cosmetics, automobiles, jewelry, and cosmetics. Overall, the ravaging impact of the pandemic made the retail trade decline 3.9% YoY. Retail sales stood at 39.20 trillion yuan ($6.05 trillion) in 2020. America’s CPI as of December 2020 was +0.2%, indicating a gain in the economic recovery options into 2021.
Technical analysis

The USD/CNY trading pair may find resistance at the 6.72000 level as the US dollar gains in the first quarter of 2021. Growth in China’s retail sales may make the trading pair break down below the 6.4379 support level as the economy strengthens post-pandemic. Traders are in a strong sell position with the 14-day RSI at 38.349. The 100-day SMA shows resistance at 6.4575 while the EMA is at 6.4554.


