- India increased its trade relations with China over the US in 2020.
- The Biden Administration is expected to review tariffs imposed on Indian exports.
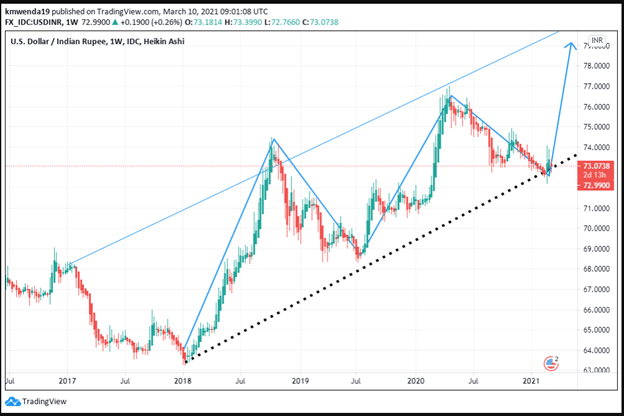
- The USD/INR may test highs above 79.00 after a review of trade terms.
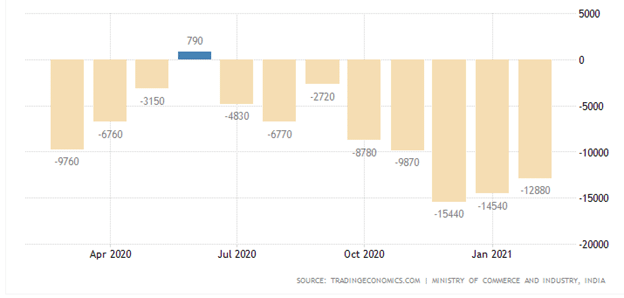
The USD/INR trading pair has declined 5.34% in the 52-week analysis as India narrowed its trade deficit in goods to $14.54 billion in January 2021. As of January 2020, the trade deficit was $15.3 billion representing growth in exports by 4.97%. In 2020, there were bilateral tensions between the US and India over tariffs that were imposed under the Trump administration. Trade tensions have been more consequential to India as opposed to the US.
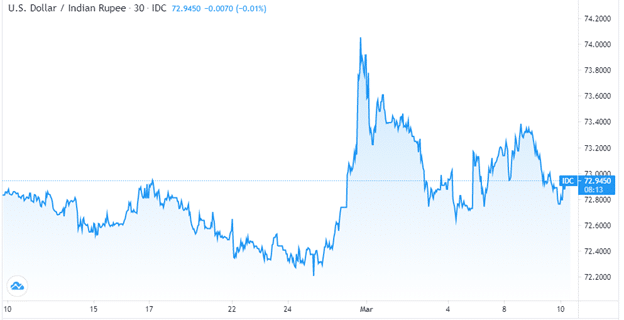
China overtook the US as India’s main trade partner, and the trade deficit is expected to rise in 2021. The Indian rupee has stretched its gains from February 10, 2020, to March 10, 2020, by 1,33%, maintaining resistance of the USD/INR currency at 73.937.

USD/INR Chart
Tariffs
India raised its tariffs in Q4 2020 from 0% to a range of 15-20% on key US exports, including mobile phones and other telecommunications products. In turn, it opposed the 25% tariff on steel and 10% on aluminum that the former Trump Administration had imposed in 2018. The USD/INR fell to a 5-year low of 63.540 in 2018. US-India trade dispute has affected $1.32 billion worth of exports from the US that include agricultural, chemical, and steel products. In February 2021, the dollar eased against the rupee as optimism rose over the new Biden Administration that would resolve trade disputes between the two countries.
India’s trade deficit in February 2021 widened 26.47% from $10.2 billion to 12.9 billion YoY. This increase was caused by a 7% increase in import value to $40.55 billion, while exports decreased by 0.3% to $27.67 billion.

Economic recovery
The first quarter of 2021 will see India emerge from recession, as seen in the falling trade deficit levels. Projections by the Organization for Economic Cooperation and Development (OECD) indicate that India’s GDP will widen by 12.6% from Q2 2021. China is expected to grow by 7.8% in 2021, making India the quickest growing economy post-pandemic. Successful implementation of the stimulus plan will see America expand its GDP by 6.5% in 2021 as the world economy surges 5.6% in 2021.
The fourth quarter of 2020 showed that there was global economic recovery despite the resurgence of the new COVID-19 variant that has spread into Q1 2021. India is expected to grow by 11% in the fiscal year 2022 as the country flattens the affliction curve for COVID-19.
The entrance of China as India’s main trading partner may increase the dollar’s value due to scarcity and the weakened dollar. In 2020, India’s exports to China soared 16.15% to $20.87 billion from $17.9 billion in 2019. India capitalized on the diplomatic spat between Australia and China to increase exports of iron ore, aluminum, and copper, among other products.
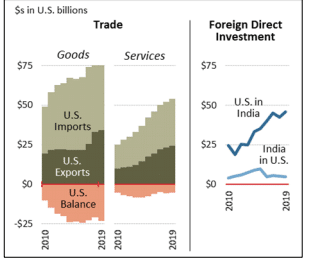
Economic data from 2019 showed that the total trade value of goods and services between the US and India amounted to $146.1 billion. The trade deficit was then $28.8 billion, with exports at $58.6 billion and imports at $87.4 billion. India’s trade accounts for 3% of the global US trade, and Biden’s Administration will work to review trade terms as seen in the foreign direct deposits (FDI).

Technical analysis

USD/INR Analysis Chart
The USD/INR trading pair is headed towards testing levels above 79.00. The dollar’s recent declining value and a higher balance of trade may push the USD/INR amid China’s growth in trade with India. The pair traded at 72.960 on March 10, 2021, testing the 20-day SMA at 72.968. The 14-day RSI is neutral at 48.496 as investors watch the risk movement.


