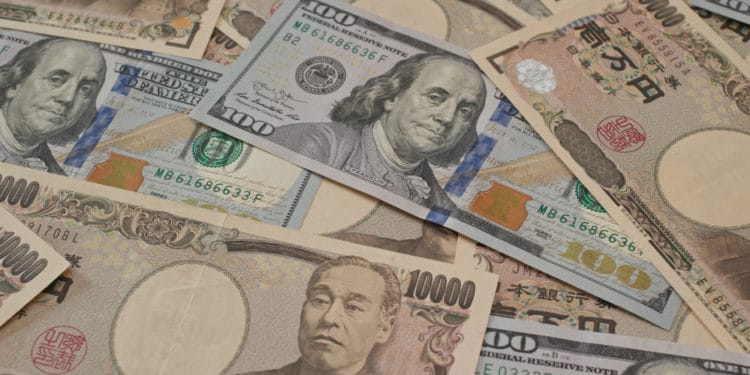
The USD/JPY pair jumped to the highest level since April 6 after the relatively weak economic data from Japan. It is trading at 109.84, which is 2.25% above the lowest level in April.
Japan unemployment rate and Tokyo inflation
The Japanese economy is doing quite well. Its manufacturers like Toyota, Nissan, and Mitsubishi have grown sales as demand for automakers has jumped. The services sector, too, has continued to perform well, as evidenced by the flash PMI numbers published last week.
The USD/JPY rose on Friday morning after Japan published relatively weak unemployment rate data. According to the statistics office, the unemployment rate rose from 2.6% in March to 2.8% in April. This was higher than the median estimate of 2.7%.
In the same period, the jobs to applications ratio dropped from 1.10 to 1.09, mostly because of the state of emergency orders implemented by the government.
Still, these numbers are better than in other countries. For example, in April, the American unemployment rate rose from 6.1% to 5.8%. Similarly, in the United Kingdom, the unemployment rate is at 4.8%, while the average rate in the European Union is more than 7%. This is simply because many Japanese companies retained their workers even with the pandemic.
Meanwhile, data showed that consumer prices in Tokyo declined by 0.4% in April while core CPI fell by 0.2%. As the biggest city in Japan, analysts pay closer attention to its inflation numbers.
Therefore, with the unemployment rate rising and the inflation rate below 1%, there is a possibility that the Bank of Japan (BOJ) will take a longer time to abandon its easy-money policies. In its response to the pandemic, the central bank lowered interest rates and expanded its existing asset purchases. Indeed, BOJ has now become the biggest holder of Japanese debt and even stocks.
US data dump
The USD/JPY also rose after the data dump from the United States. On Thursday, data by the Labour Department revealed that the country’s initial jobless claims declined to 406k last week. This was better reading than the median estimate of 425k and the previous 444k. It was also the best performance since the pandemic started in 2020.
Further, the continuing jobless claims declined to more than 3.64 million. This is another evidence that the labor market has continued to tighten as most states reopen.
Meanwhile, the second estimate of the GDP data showed that the economy expanded by 6.4% in the first quarter. This was slightly lower than the expected estimate of 6.5%. Further data showed that the overall durable goods orders declined in April while pending home sales fell by 4.4%. This is despite the fact that the overall home prices have jumped to the highest level in more than 15 years.
On Friday, the USD/JPY will react to the latest personal consumption expenses (PCE) data. This is an important gauge that the Federal Reserve uses to measure inflation.
USD/JPY technical outlook
The four-hour chart shows that the USD/JPY has jumped in the past few sessions as investors price-in a divergence between the Fed and the Bank of Japan.
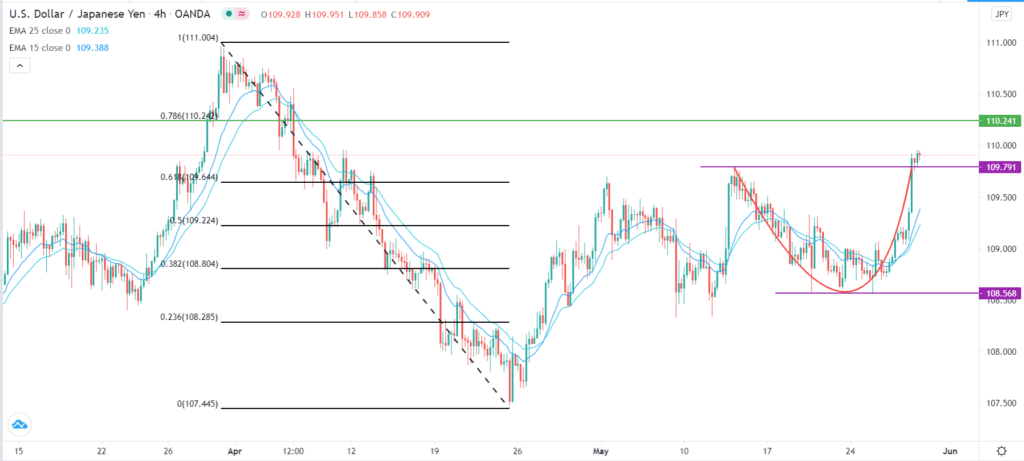
The pair has formed what looks like a cup and handle pattern that is shown in red. It has also moved above the 61.8% Fibonacci retracement level.
The upward trend is also being supported by the 15-day and 25-day Moving Averages. Therefore, in the near term, the pair may keep rising as bulls target the 78.6% retracement level at 110.25.


