ForexEzy
No Result
View All Result
  • Top Forex Advisors
    • Best Forex Robots
    • Best Forex Signals
    • Best Managed Accounts
  • Top Forex Brokers
    • Best Forex Brokers
    • US Forex Brokers
    • UK Forex Brokers
    • MT4 Forex Brokers
    • MT5 Forex Brokers
    • Zero Spread Brokers
    • Best PayPal Brokers
    • TradingView Brokers
    • Social Trading Platforms
  • Top Review Platforms
  • Forex Education
    • Getting Started
    • Forex Basics
    • Forex Trading Strategies
    • Money Management
    • Risk Management
    • Technical Analysis
    • Fundamental Analysis
    • Trading Psychology
    • Social Trading
    • Automated Trading
  • Forex Tools
    • Forex Robots
    • Forex Indicators
    • Forex Signals
    • Forex VPS
  • Forex Forecast
  • Crypto
    • Best Crypto Exchanges
    • Best Crypto Bots
    • Crypto Guides & Forecasts
No Result
View All Result
ForexEzy
No Result
View All Result
The World’s Leading Social Trading Platform
Try now
Home Forex Education Technical Analysis

Using Trendlines and Saucer Formations in Trading

by Tim Baudin
December 21, 2020
in Technical Analysis
0
Using Trendlines and Saucer Formations in Trading
0
SHARES
11
VIEWS
Share on FacebookShare on Twitter

Trendlines are those lines that you can recognize easily. A trader draws trendlines on charts in order to connect a series of prices or show the best fit of some data. You can use the resulting line to grasp a good perspective of the next direction of an investment’s value movement. 

Using Trendlines and Saucer Formations in Trading

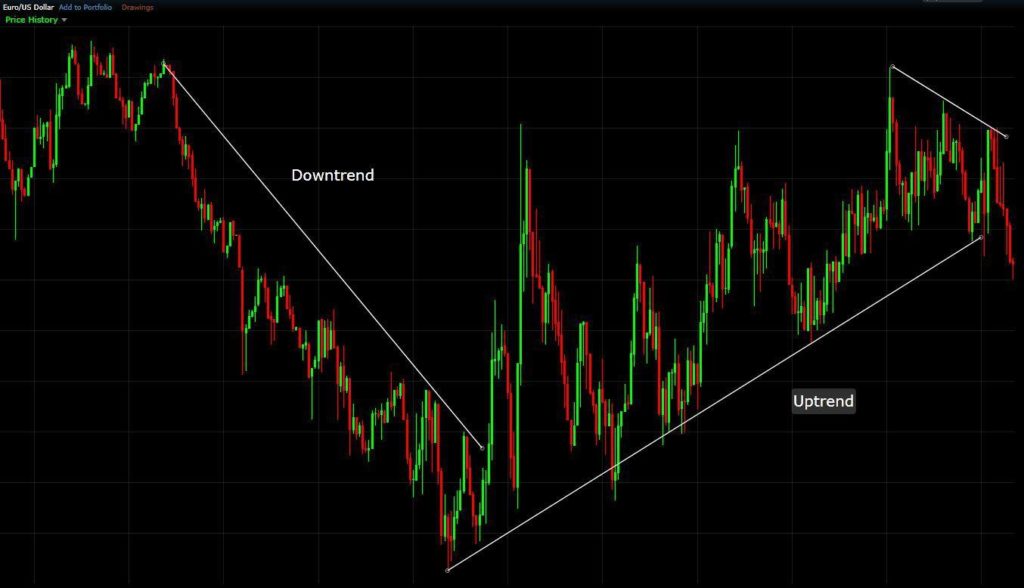
You can draw the trendline beneath pivot lows or above pivot highs for showing the prevalent price direction. To put it simply, these lines are a visual representation of support and resistance within any time frame. Not only can you see the direction and speed of price from them, but patterns are also described during price contractions. 

The Best Forex Robots Report Is Already Here!
best forex robots
Check out 30+ best expert advisors with daily updated live results and statistics
Click Here

Using Trendline for Break and Reversal

When it comes to trading tools, trendlines are the most versatile ones that can be used in day trading, position trading, and swing trading. However, traders often make errors while drawing them. And that is why you need to learn well how you can use trendlines for break and reversal. Let’s begin. 

Trendline Breakout Strategy

Sometimes, you may find it difficult to schedule your entries in a trending market due to a deep or shallow pullback. If you enter too early in the case of a deep pullback, you will suffer losses. On the contrary, if it is a shallow pullback and you enter too late, there is a risk that you will miss the move. The trendline breakout technique is the solution to this problem. 

What you need to do is wait until a pullback is in an uptrend. After that, you will have to draw a trendline that connects the highs of the pullback. You can enter the trend if the price breaks the trendline. The logic behind this technique is if the price breaks over the trendline, it indicates that the trend will most likely resume and the buyers are in control. If the price does not break, it indicates sellers still being in control, and you must wait until buyers regain control. 

Use of Trendlines to Identify Trend Reversal

This is one of those situations that many traders face while following the breakout strategy. So, what happens is, when they see price break over the downward trend line, they think that the market will reverse higher because the trend line is broken. However, a completely opposite scenario takes place as the downtrend resumes, and the market goes lower. This is confusing for many traders. 

You have to keep in mind that the trend is not necessarily over just because a trend line is broken. The market is prone to such false breakdowns. This is why a trendline requires regular adjustment. To identify an upside trend reversal, you must wait until the price breaks above the trendline. Now, wait a bit more and give a higher low time to form. When this happens, you can be sure that the sellers are exhausted. If the price breaks the swing high after this, the market is going to reverse higher. The buyers are in control now. 

What Is a Saucer Formation?

A saucer formation is also known as rounding bottom. It is a technical charting pattern that indicates a potential reversal in the price of a security. It is formed when the price of the security reaches a low and starts upward trending. 

Generally, saucers are formed at the support levels of security. It can be channels, trendlines, or any other alternative that can define the support and demand relationship of that security. These take place when a financial instrument refuses to a low and starts trending upward. As a result of this price action, a U-shaped chart pattern is formed. With a flatting bottom, it is usually very rounded. 

Examples of Saucer Formations

You can use several channels in order to chart the support and resistance trendlines around security price. Envelope channel patterns are fluid formations that can help you to follow a security’s price over a long period. When it comes to envelope channels, the Bollinger Band channel is the most common one. This channel draws support and resistance trendlines that are two standard deviations below and above the moving average. Different envelope channels have different methodologies to chart trendlines. Other such channels are Keltner Channels and Donchian Channels. 

If you are a trader who prefers tighter support and resistance trendlines, you can also draw channels at the peaks and troughs of the price of a security over a specific time frame. The channels may ascend, descend, or depend sideways on the price trend of the security. 

Standard trading channels and envelope channels

Both patterns are equally important for traders who want to use a saucer formation for identifying and placing profitable trades. Saucers are generally formed at the support trendline. It can take place in a high-volume selloff that pushes the price down to its lowest level. This low price level will frequently be in the support zone, the area around the support trendline. You will often see a great extent of uncertainty in price in the support zone. 

This zone is known for acting as the floor of security. Hence, traders anticipate that the price cannot fall past this level. However, things can be different due to some factors like trading mechanisms, supply, and demand that can lead the price to fall below the support level. At this point, you can consider volume to be an essential indicator because the pricing sentiment of investors influences it highly. 

Saucer Formation

A saucer formation takes place if the price does not trend lower and, instead, starts an uptrend. It follows the traditional investing methodology, and traders anticipate this movement the most. Generally, traders want to buy call options on the security or buy the security when it is at its lowest price. This is the best way to gain the benefits from a saucer formation. 

As you can see, trendlines and saucer formations are closely related. To avoid risks and losses, it would be best to learn about them better before you use them in trading.

The Best Forex Robots Report Is Already Here!
best forex robots
Check out 30+ best expert advisors with daily updated live results and statistics
Click Here
ShareTweet
Previous Post

Understanding Regulation In Forex

Next Post

Yeti Forex Robot Review

Related Posts

Trading With Balance of Power Indicator

Trading With Balance of Power Indicator

by Adam Stanley
December 9, 2021
0

The Balance of Power (BOP) indicator is an analysis tool created by Igor Livshin in August 2001. It tracks the...

What Are Pennant Chart Patterns in Forex: Step by Step Guide

What Are Pennant Chart Patterns in Forex: Step by Step Guide

by Chintan Patel
November 15, 2021
0

Continuation patterns in the forex market are a common occurrence whenever there is a large movement in one direction followed...

How To Trade Ascending Scallops in Forex

How To Trade Ascending Scallops in Forex

by Adam Stanley
November 10, 2021
0

Price in the Forex market does not always move in one direction. After a significant move in one direction, up...

Inverted Scallops in Forex Chart Patterns: Step by Step Guide

Inverted Scallops in Forex Chart Patterns: Step by Step Guide

by Adam Stanley
November 9, 2021
0

Whenever prices move up significantly in the forex market, exhaustion often kicks in. In most cases, the fatigue is usually...

Elder’s Method in Forex Trading

Elder’s Method in Forex Trading

by Tim Baudin
November 3, 2021
0

There are several strategies that traders and analysts have developed over the years, all in a bid to milk the...

Load More

Leave a Reply Cancel reply

Your email address will not be published. Required fields are marked *

Best Forex Automated Systems

  • TechBerry 9/10
  • Happy Galaxy 8.5/10
  • Forex Cyborg 8.5/10
  • Forex Fury 8/10
  • FXgoodway 7.5/10
  • Best Forex Brokers
  • Best Forex Robots
  • Best Forex Signals
  • Best Forex Managed Accounts

Top Trading Markets

We are dedicated to demystify the world of forex trading for you – no matter what level you are on.

Categories
  • Automated Trading
  • Crypto Robot Review
  • Cryptocurrency Trading
  • Day Trading
  • Forex Basics
  • Forex Brokers
  • Forex Education
  • Forex Forecasts
  • Forex Indicators
  • Forex Market Commentary
  • Forex Robots
  • Forex Signals
  • Forex Signals
  • Forex Tools
  • Forex Trading Strategies
  • Forex VPS
  • Fundamental Analysis
  • Managed Accounts
  • Money Management
  • News
  • Review
  • Review Platforms
  • Risk Management
  • Social Trading
  • Technical Analysis
  • Top World Traders
  • Trading Apps
  • Trading Psychology
  • Uncategorized
Tags
Acquisition AI Amazon Apple Artificial Intelligence Bitcoin bond yields CEO China earnings earnings report economy Electric Vehicles Federal Reserve financial performance Financial Results forex ea forex software reviews Growth Guidance Housing Market inflation interest rates Investing investment Investors Market Volatility merger mortgage rates net profit Nvidia Oil prices Q2 Results revenue Revenue Growth Sales sales growth Stock Futures stock market stock performance Stocks strategies technology Tesla Video
  • Terms of Use
  • Privacy Policy
  • Compensation Disclosure
  • Risk Disclosure
  • About Us
  • Contact Us

Copyright © 2023 by ForexEzy.com

No Result
View All Result
  • Top Forex Advisors
    • Best Forex Robots
    • Best Forex Signals
    • Best Managed Accounts
  • Top Forex Brokers
    • Best Forex Brokers
    • US Forex Brokers
    • UK Forex Brokers
    • MT4 Forex Brokers
    • MT5 Forex Brokers
    • Zero Spread Brokers
    • Best PayPal Brokers
    • TradingView Brokers
    • Social Trading Platforms
  • Top Review Platforms
  • Forex Education
    • Getting Started
    • Forex Basics
    • Forex Trading Strategies
    • Money Management
    • Risk Management
    • Technical Analysis
    • Fundamental Analysis
    • Trading Psychology
    • Social Trading
    • Automated Trading
  • Forex Tools
    • Forex Robots
    • Forex Indicators
    • Forex Signals
    • Forex VPS
  • Forex Forecast
  • Crypto
    • Best Crypto Exchanges
    • Best Crypto Bots
    • Crypto Guides & Forecasts

© 2023, Forexezy. {copy} {year}