MetaTrader 4 or MT4 is hugely familiar to virtually every forex trader in the world and has existed for 16 years. It’s a no-frills, simple-to-use trading platform for analyzing charts and executing positions.
Other competing software packages like cTrader and NinjaTrader also have their prominence in different sections of the investing community. Still, one platform that’s undoubtedly cemented its place is TradingView, the impressive browser-based charting service, and social media trading network.
Rightfully describing itself as ‘the fastest way to follow markets,’ TradingView is revered for supremely responsive and beautiful charting capabilities for a wide range of instruments. Consequently, many religious MT4 users have either switched completely to TradingView or spend much of their time on it.
One of the main reasons is some tools on the service are unique and aren’t found with other software packages. While a few of these perks may come at a premium, they reflect valuable information about the markets. This article will cover three of these tools and how they can provide an edge.
1. Heiken Ashi charts
MT4 only has three types of charts; bar, line, and candlesticks. In contrast, TradingView boasts 12, one of which is the Heiken Ashi. The Heiken Ashi is essentially a stripped-down version of the Japanese candlesticks, which is highly beneficial for several reasons.
From a distance, they visually and structurally appear very similar to Japanese candlesticks. Heiken Ashi charts show the open, close, high, and low prices as their counterparts do. However, the main distinction is that they use a different formula to calculate these values, providing an average price.
The result is a noise-filtering and smoother-looking chart particularly adept at showing the extent of trends and possible reversal points.
With a normal candlestick chart, while one receives an intricate display of price movements, many of these are essentially ‘noisy’ and don’t always provide a clear direction. On the other hand, the Heiken Ashi is a lot cleaner.
Example:
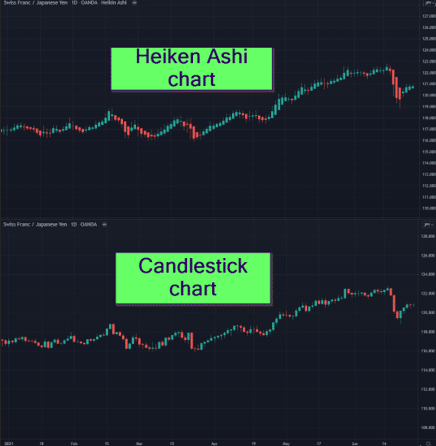
In the image below, we’ll realize the subtle differences between the two over the same period from January 2021 until the present.
Traders utilize Heiken Ashi to stay in trends for longer without being whipsawed due to the expected noise of candlesticks. Moreover, because the colors of the candles on Heiken Ashi tend to remain consistent, any change after a sustained movement is usually considered a more reliable exit signal or sign of a pullback or reversal.
Best of all, the Heiken Ashi charts are available on the free version of TradingView.
2. Williams VIX Fix Bollinger Band Indicator
Another unique element on TradingView not found in many other platforms is the Williams VIX Fix Bollinger Band Indicator. This indicator is essentially a volatility index applicable to many other tradable assets aside from currencies.
The indicator attempts to forecast potential turning points in the market. It works on the principle of fear and greed, sometimes also referred to as the fear and greed index in other instruments.
When the volatility index is at its highest, it signals traders in that market are either greedy or fearful about the future. The indicator allows traders to quantify the levels of these two extremes.
If we observe the chart below, as the green bars rose, it suggested the highlighted zone might have soon been a possible turning point.
Example:
After about eight days, we can see the market began selling off. At its current moment (highlighted in the grey rectangle), the green bars are higher than the previous bars, suggesting another possible turning point and resistance.
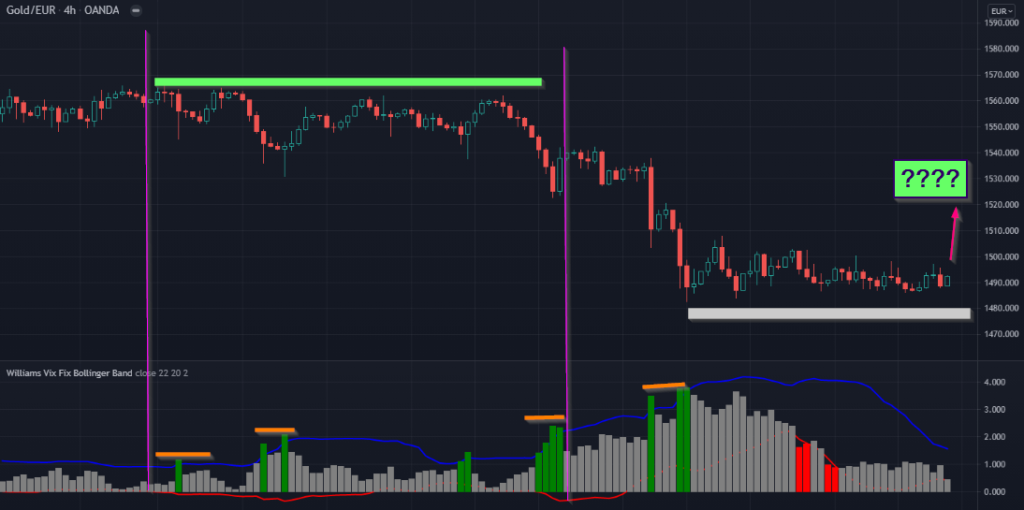
Of course, as with any tool, it’s best used with a combination of other factors and does not necessarily provide an entry signal. This volatility index is more observational but can be a brilliant confirmation method. Fortunately, it is also available on TradingView’s free plan as well as some other MT4 indicators.
3. Volume Profile Visible Range
Yet another potent tool is the Volume Profile Visible Range (VPVR), which is especially useful for traders who understand volume or would like to better incorporate it in their trading.
The MT4 volume indicator is rather bland as it only displays volume for each candlestick period. In contrast, VPVR is distinct because it presents the volume at each price level, hence why it shows horizontally on the right-hand side of the screen instead of at the bottom.
This attribute is paramount as it alerts traders on the aggregate volume of buyers and sellers at specific prices, providing analysts the significance of these levels. In simpler terms, the VPVR is a powerful way to determine strong support and resistance zones.
The green bars show the buyers, while the red bars show the sellers. So, what is the main way of using this tool? Traders will look when substantially more volume appears at certain areas than in others, signaling the importance of those levels for traders as ‘heat maps.’
Example:
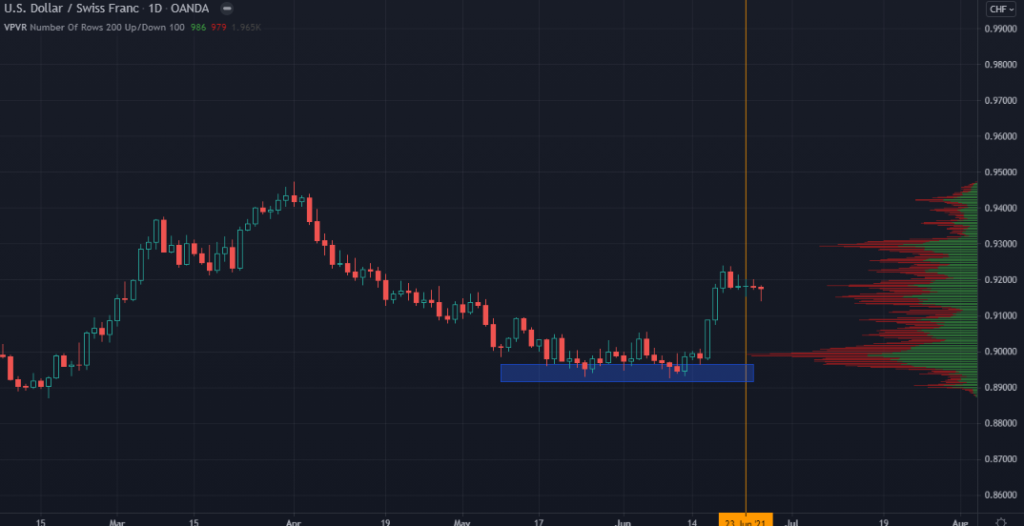
On the chart below, we see an orange line reflecting a noticeably longer histogram bar. This suggested a ‘hotspot’ of high trading activity, an area of some importance in the market and possible support level.
Compared to all the histograms, this one stood out. Conversely, when the bars don’t show as strongly, this suggests weaker volume where the price is likely to breach. Sadly, this indicator is only available on the Pro, Pro+, or Premium versions on a monthly or annual subscription.
On the bright side, TradingView typically has 30-day free trials and discounted membership for new users to take advantage of this tool.
A quick tip: For better clarity, users must change the row size to 200 and value area volume to 100 on the inputs settings.
Final word
Many traders will agree TradingView is probably the best for highly aesthetic and protean charting capabilities in a plethora of tradable assets. However, MT4 is somewhat of an old-school platform. Although MT5 is much better, it’s still weak in many areas and hasn’t technically been upgraded since.
On the other hand, TradingView is cutting-edge and constantly adds new features for its users. Therefore, the tools on this list only scratch the surface as traders can benefit much more from TradingView. Also check the comparison of MT4 and TradingView.


